Advantages of Pandas Library for Data Analysis Sujeet Pillai February 16, 2023

What is Pandas library?

Pandas is a general-purpose Python library for data analysis and manipulation, including data processing, analyzing, filtering, and aggregation. Pandas library is used in almost any process of extracting information from data using code. The name “Pandas” refers to both “Panel Data” and “Python Data Analysis” and was coined in 2008 by Wes McKinney. Pandas library is a fast, powerful, flexible, and easy-to-use open-source data analysis and manipulation tool built on top of Python programming language. Pandas library can easily manipulate the data and conduct data science analysis operations. It was first released in 2009 and has since grown in popularity as a tool for performing data analysis operations. Pandas are an essential component of the data science life cycle. Along with NumPy in matplotlib, it is the most popular and widely used Python library for data science.

Advantages of Pandas Library for data analysis-

1. Enhanced data analysis 

Pandas greatly simplify data analysis and statistical computations, making life easier for data analysts, scientists, and developers. In addition to its stat deduction power, it’s also ideal for transforming raw data into an actionable form. It can clean up messy datasets and organize multiple variables by creating powerful visualizations. Plus, Pandas library accelerates your workflow when dealing with large datasets compared to other Python libraries.

2. Easy to Use and Readable

Pandas have a straightforward and intuitive syntax that is simple enough for beginners to grasp. The library provides a range of functions that can be easily chained together to perform complex data analysis tasks, making writing efficient and making code easy to read. Pandas library can perform operations on data with few lines of code. It saves time and prioritizes creating efficient algorithms for data analysis compared to Python, which takes a lot of time. 

For example-

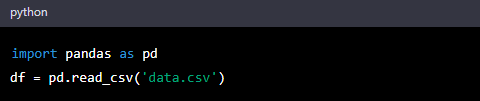
To read a CSV file into a Pandas DataFrame, you can simply use the read_csv() function:

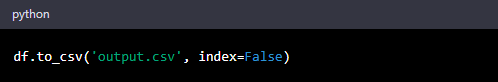
To write a Pandas DataFrame to a CSV file, you can use the to_csv() function:

3. High Performance with Large Datasets

Pandas library can handle large datasets efficiently, even with limited memory resources. It does this by using techniques such as lazy evaluation, which only loads data into memory when needed, and compressing data where possible. Pandas library uses vectorized operations, which enables them to perform computations on entire arrays of data in a single operation. This is much faster than performing computations on individual elements. Furthermore, Pandas also support parallel processing, which allows them to distribute processing across multiple cores or processors. This helps to speed up your computation time, especially for large datasets.

4. Integrates seamlessly with other Libraries

Pandas library integrates easily with other popular libraries in the Python ecosystem, such as NumPy and Matplotlib. This makes using them together for data analysis incredibly streamlined, allowing you to quickly and ably perform powerful data analysis without needing to learn a whole new library. With Pandas, you can use it to wrangle the data into the format you need before accessing the plotting or numerical capabilities of other libraries like PyTorch.

5. Robust Graphical Support for Better Insights

Pandas library makes visualizing your data a breeze! With the matplotlib library, you can access all kinds of graphs and charts to display your data in an easy-to-digest format. From bar plots to pie charts, scatter plots to histograms, Pandas can create informative yet visually appealing graphics. Using the power of basic statistical mechanics, experienced analysts and marketers can easily glean valuable insights from these charts while allowing newcomers to experiment with data without being overwhelmed by the details.

6. Faster Processing and Reporting

Pandas library is built on NumPy, a fast and efficient numerical computing library for Python. This means that Pandas can use NumPy’s array-oriented computing capabilities to perform operations on large datasets in a highly optimized manner. Further, Pandas library provides a wide range of data manipulation and transformation functions that enable analysts to quickly clean and transform data to suit their needs. For example, it provides functions for filtering, sorting, grouping, and aggregating data, which can be performed promptly. Whether you need to quickly process and report on large datasets or crunch numbers in the background, Pandas can do it faster than other libraries.

7. Easier Data Cleaning and Wrangling

Pandas library makes data wrangling, cleaning, and pre-processing easier. Thanks to its inbuilt methods, you can effortlessly avoid irritating white spaces or jumbled string outlines while dealing with datasets. Its sophisticated string manipulation helps cut down development time and increase the overall performance of applications. Alone, these features make Pandas an absolute hidden gem for data analysis.

8. Analyze Unstructured and Tabular Data

Pandas library simplifies data visualization, even with unstructured data like text, images, and videos. It can extract meaningful information from them through text mining and sentiment analysis. For structured data like spreadsheets or databases, Pandas provide powerful tools for filtering, grouping, aggregating, and joining data. It can read data from various files such as Excel, CSV, or SQL formats and perform complex analyses and visualizations.

9. Handles missing data well

Pandas can help in data alignment and handling missing values from the data. By default, it sets any null or missing data to NaN, helping you quickly identify and remove unnecessary information. Pandas library also provides methods such as fillna() to help you replace the missing values with more accurate and useful data for downstream analysis. With this feature, handling corrupt and incomplete datasets is made much easier. It can detect missing values and enable us to drop a column or a row with dropna() or fill it with a constant value.

Conclusion-

From learning data structure and data manipulation to powerful data analysis algorithms, Pandas library is the best for leveraging the power of Python in data analysis. With its array-oriented approach, intuitive commands, and a plethora of features, Pandas simplifies and speeds up discovering insights from your data. With its user-friendly interface and extensive documentation, Pandas library is easy to learn and use for both beginners and advanced users. Whether working with spreadsheets, databases, text, images, or videos, Pandas can help you gain valuable insights from your data and make informed decisions.

Python for Mobile App Development Sumeet Shah November 23, 2022

What is Python?

Python is a major scripting language that includes compelling semantic features. Its clear, easy-to-learn syntax emphasizes readability, lowering the program’s maintenance costs. And the syntax is nearly identical to that of English. Guido van Rossum, a Dutch programmer, designed Python and released it in 1991. Python 2 is the most extensively used as compared to its latest version, Python 3. The language codes are written in a text editor or an integrated development environment, such as Thonny, Netbeans, or Pycharm (computer programs). So what does Python do?

  1. It can handle massive data and perform complex calculations
  2. It can connect to database systems and read or modify the files
  3. When used alongside a software application, it can create workflows
  4. If used on a server, it establishes web applications
  5. It is also used in the development of software prototypes

Did you know: Python has been a crucial part of Google since its establishment as a search engine?


Why use Python coding in mobile app development?

Python is an outstanding language for mobile app development because:

  1. It is straightforward, easy to read and write, and powerful when solving complex problems. 
  2. Its huge standard library allows you to integrate the language with third-party APIs or modules.
  3. It can be used on various platforms, including iOS, Windows phones, and desktop computers.
  4. It also works on Windows, Linux, Macintosh, and Unix and has been ported to Java and virtual machines (.NET)
  5. Although Android does not support native Python, it can be used in mobile app development. It is possible by using various tools that convert Python apps into Android Packages that run on Android devices.
  6. Python frameworks aid in the development of mobile apps in a shorter time.
  7. You only need a capable device, such as a laptop/desktop computer running Ubuntu, macOS, or Fedora. Alternatively, you can use mobile phones, such as the Galaxy S4, Nexus 5, etc., for Python coding.

Did you know?: Python is used in developing applications like YouTube, Instagram, Spotify, Quora, Dropbox, Pinterest, Reddit, and many others.

Frameworks to build mobile apps with Python:

Python does not support the interpreted languages by iOS or Android. In fact, Python apps cannot run natively. And at this point, various frameworks emerge to bridge the gap, allowing these apps to run on mobile devices with a native appearance and functionality. 

The preferred implementation language for Android is always Java. So, to write an Android application in Python, you need a way to run its code on a Java virtual machine. The steps for creating an app for iOS are comparatively more complex than those for Android.

So which frameworks can help you to develop an actual application on your device? Let’s take a look-

VOC

VOC (Vestigial Output Compiler) is a component of the BeeWare suite that allows you to access Java native objects and implement Java interfaces in Python classes. It takes Python’s source code, compiles it to CPython bytecode, and then transpile it into Java-compatible bytecode (machine code). The result is that your Python source code files are compiled directly into a Java .class file, which is then packaged into an Android application. It will allow you to write Android applications now to the native API of Android. Once you’ve registered your native Android application, you can use Briefcase for packaging your Python code as an Android application.

Python-for-Android

It is a tool for integrating Python with Android. Its primary function is to create Android APKs that can be installed or uploaded to marketplaces such as Play Store. The first function of the tool is to compile the Python interpreter, its dependencies, backend libraries, and Python code for Android devices. By totally customizing this stage, you can install whatever components you like. This results in a standalone Android project used for generating any number of different APKs, even with other names, icons, Python code, etc. The second function of Python-for-Android is to give a simple interface to these distributions.

Kivy

Kivy is a cross-platform framework that lets you create apps and games for Windows, Linux, iOS, and Android. Kivy has an extensive Python library with many features, such as multitouch events and so on. These multitouch gestures aid in developing rich user experiences (UX) with less effort. Kivy also supports the use of native libraries on various platforms. You can directly call functions from its central platform and also access features that Python does not offer.

PyJNIus 

PyJNIus allows you to create Android apps without any prior knowledge of Java. It gives access to Java classes and methods using Python, making it a powerful tool for mobile app development. Its framework even allows Python to interact with the Android API. Developers use this API to obtain information from various parts of their mobile devices through pause, vibration, etc., functions.

In a nutshell:

Python has become one of the most eminent programming languages. It’s easy to learn, and there are lots of free online tutorials available to learn Python. You can use Python to write programs for almost any application, including web applications, mobile app development, desktop apps, games, scientific computing, and much more.

Is Python worth learning in 2022 Sumeet Shah July 20, 2022

What Is Python Used For? A step-by-step guide for Beginners

What is Python?

Python is a dynamically semantic, interpreted, object-oriented high-level programming language. Python is a general-purpose programming language, which means it can be used for a variety of tasks such as data research, software and web development, automation, and just getting crap done in context. Python’s concise, easy-to-learn syntax prioritizes readability, which lowers software maintenance costs. Modules and packages are supported by Python, which fosters program modularity and code reuse. Guido van Rossum created Python, and it was published in 1991.

What is Python used for?

1. Web Development:

Python is a popular choice for complicated web development projects because of its versatility, which allows for the creation of sophisticated online utilities with ease. Web developers that use it save a lot of time and energy because of its straightforward syntax, which is quite comparable to the English language. Python is a very flexible backend language. Backend or server-side functionality can be handled more easily using Python-based web frameworks like Django. Python’s prominence in web development is largely due to frameworks and libraries such as Django and Flask, which enhance the language’s capabilities.

2. Data Analytics/Data Science:

Python is used to create several of the most popular data mining tools. As a result, it’s a fantastic data science tool. Data scientists and analysts alter data using coding languages like Python and R for reporting, predictive analysis, and other purposes. The Pandas library is a major advance forward from the outdated Excel files that have been used for so long for financial research. NumPy also allows you to perform linear algebra, scientific computing, and a variety of other specialized tasks. Python’s features enable programmers to distinguish between crucial and relevant data. Organizations may learn more about themselves by interpreting big data well.

3. AI and ML:

These days, artificial intelligence and machine learning are buzzwords, but the fact is that it all boils down to algorithms, code, and logic. Machine learning is the process of teaching computers to learn on their own using algorithms that are continually updated based on incoming data. Python is often regarded as the greatest programming language for Artificial Intelligence (AI) due to its clear syntax and ease of learning. Given the diversity and capability, it’s no wonder that some genuinely world-class tools for producing intelligent behavior exist in Python.

4. Financial Analysis:

When recruiting engineers, the most popular programming language considered by FinTech organizations is Python. Python is gaining popularity as a result of its potential financial services. Python’s utility in applications such as data regulation, analytics, risk management, and quantitative rate difficulties is the reason for its appeal. More than only FinTech companies use Python programming. Python is widely used everywhere in the financial industry due to its data processing skills and various third-party financial analysis tools.

5. Scripting:

The script language generates code and is very easy to learn, even for newbies. Python is widely used in programming and is an interpreted language that occurs during runtime. It becomes more flexible and adaptable than many other scripting languages since it translates to code. In a program, a script is used to automate particular operations. It can run on its own and requires less code, but modules in Python are referred to as libraries that cannot run on their own. It must be imported before it may be used. Python is classified as a scripting language since it is an interpreted language and its popularity in scripting relates to its simple scripting interface.

Frequently-asked Question

What is Pandas Python?

Pandas is a widely used open-source Python library for data science, data analysis, and machine learning activities. It is developed on top of NumPy, a library that supports multi-dimensional arrays. It provides quick, simple, and adaptable data structures for working with structured (table form, multivariate, possibly heterogeneous) and time-series data. Pandas is a Python data science module. It works well with many other Python data science modules and is normally included in every Python installation. Among other things, Pandas supports re-indexing, repetition, filtering, data analytics, sequences, and representations.

Extensive Guide to Choose the Perfect Software Developer Amit Jain June 16, 2022

In recent years, many organizations have chosen outsourced software development rather than hire in-house software developers to meet their IT development demands. Of course, such companies must fully grasp the variables to consider when picking an outsource software development company to work with in order to ensure that the result fulfills their criteria.

Around the world, there is a considerable surge in software development outsourcing companies. As a result, businesses are now confronted with market realities that must be considered at the outset of the decision process. Check out these tips on how to properly set expectations for your software developer to help you select the ideal one for you.

1. Ensure that the Software Developer has Extensive Technical Experience:

Software Developers of high quality often have a wide variety of experience with various technologies and a thorough understanding of how they work and when they should be employed. The software developer cannot be considered an expert unless he or she has substantial technical experience. The finest software developers will draw on their wide industry knowledge and technical talents to produce world-class results and quickly solve hurdles. If at all feasible, choose developers that have worked on projects comparable to yours leveraging the same technology, as this helps you to benefit from their previous experience and improve project development.

2. Evaluate Soft Qualities that Make an Excellent Software Developer:

Curiosity, Creativity, Open-Mindedness, Passion, and Resilience are qualities that create an excellent software developer. Nothing is off limits; talented software developers and coders should be permitted to think creatively. Curiosity is essential to address crucial difficulties, and the greater the amount of curiosity, the better. Everyone should be open to new ideas and engage in discussions about them. People are motivated to work because they care about what they do. It’s also why collaborating with others to create more effective solutions is both pleasurable and simple. A developer’s job carries a certain level of risk. It’s critical to be able to bounce back from setbacks without becoming discouraged.

3. Keep your budget in mind:

Early-stage startups rely on cash to survive. You must be diligent in your spending whether you are bootstrapping or have funding from investors. That includes paying software developers. You don’t have an option except to be picky in your choosing. It’s just a matter of finding the proper people to help you get your app to market as quickly as possible. This entails finding a developer with a lot of experience, especially in developing apps connected to your industry. When your bargaining power isn’t in your favor, the strain of choosing the proper hire within a strict budget is felt. Click here to learn how startups like yours have an advantage with Incentius.

4. Go though the Software Developer’s Portfolio:

Your prospects will have a great work portfolio, which will give you an idea of what they are capable of. The work samples of a software developer will demonstrate what they can do, the standards of their work, and their approach to development. These insights will aid in comparing alternatives and allowing you to thoroughly examine a software developer’s strengths and limitations. Work samples can also help you have a better understanding of what they’ve done in the past and provide useful information to bring up in conversation and future talks.

5. Choose the Type of Developer:

Web developers, software developers, mobile app developers, front-end developers, back-end developers, and full stack developers are all types of developers. Which one would you prefer? Before you begin looking for Developers, you must first choose which type of Developer you require. Developers typically have prior experience in a specific sector, so make sure you employ someone with the suitable skill set for the job.

6. Enlist your Requirements and Specifications:

Every organization is different, and the type of collaboration (Hire/Outsourcing) you need to make is no exception. Take some time to consider why you need a software developer. Are you launching a new app idea and need software developers to create a minimum viable product (MVP) quickly? Or are you looking for iOS developers to help you publish an app on the App Store? Some startups may already have a core development staff working on their products, but they may require the addition of fresh technology expertise. The type of developers you require will be determined by your list of criteria. It’ll help you figure out where to begin your search and how much you’ll have to spend for their services.

7. Keep in touch with your developer:

Ascertain that you can effectively communicate with the outsourcing company or the software developer. The necessity of communication between you and your client cannot be overstated. Communication is one of the most important elements to consider whether outsourcing or employing professional software developers. They must be available to speak with you every day, ideally at the same time each day, to keep you up to date on their progress. Request a phone conversation or a meeting to learn more about their communication style and see if you’re a good fit. Quality is improved via effective communication. You avoid the possibility of misconceptions that could otherwise jeopardize your project by guaranteeing continuous contact between you and your software developer.

8. Have Clarity on the project’s scope:

Companies frequently seek out software development solutions, but if the project scope is not properly defined, there may be issues in the long term. Make sure you have a clear idea of the project scope before hiring someone to do your job so you know exactly what you’re getting. Know clearly what the scope of the project entails. Make sure to be really specific. This will save you time later on in the project when it comes to haggling about fees and timelines with the software development outsourcing companies.

Incentius’ Approach to Assisting Companies With Their Development Needs

Incentius has been assisting organizations in developing their projects for years. We have a tried-and-true process for guiding startup founders through the process of understanding their needs and putting their ideas into action. We begin by obtaining the client’s needs and assessing the project’s complexity. Our team then translates the requirements into tasks that can be completed. The jobs are divided down into sections and given to our team of developers. We’ll have a lengthy talk with the client once we have a firm plan. Developers at Incentius are regarded for being forward-thinking when it comes to offering suggestions and feedback. This was clear in our dealings with all of our clients. For your organization to succeed in obtaining ideal development services, we understand that proper evaluation and selection of developers on your part is critical. As a result, choosing the correct partner to accomplish the work to your specifications and have a comparable working culture and strong ethical standards is critical. You can get more ideas about Incentius by looking at our portfolio page. Click here to reach out to us.

Pros and Cons of Cloud Computing Sujeet Pillai May 23, 2022

Companies should examine their current IT infrastructure, consider their workload and application restrictions. Then they must determine if the cloud will address or eliminate their current challenges and limitations. So, in this blog, we’ll lay out these cloud facts for you, and hopefully, we’ll cover the most significant ones to answer your queries. The following are the benefits and drawbacks of using cloud computing:

What are the Benefits of Cloud Computing?

1. Reduced administrative bottlenecks:

Cloud computing makes management easier within a company. Whenever hardware is purchased or upgraded, the entire process involves several administrative duties that consume a significant amount of time. When it comes to cloud services, all you have to do is evaluate the finest cloud service providers and their plans, then choose the one that best meets your needs. The company’s modest IT department, which it can afford to recruit, will focus only on end-user experience management. Because the majority of the other work, such as maintainability, is handled off-site, you can be assured that your IT infrastructure will be managed effectively at all times. Hence, in the cloud, your system maintenance duties are also removed. These are all left to the cloud service. Your sole criterion is that you have faith in your provider to complete the task on a consistent basis. Cloud resources are available from anywhere on the planet, at any time, on any device, and you have total control over them.

2. Huge, perhaps unlimited storage:

You’ll have to acquire the physical infrastructure that works best for your firm if you don’t use the cloud. However, you never know when you might need to enhance the storage capacity of your company. Cloud computing may free up space in your workplace for extra workstation or conveniences, while also removing the need to budget for future equipment upgrades. You won’t have to worry about installing specialized breakers, high-voltage wiring, specific HVAC systems, or even backup power if you use the cloud. The cloud allows you to easily extend your storage as your demands grow. You can buy as much storage as you need, regardless of whose cloud you use, and it’s significantly less expensive than having to buy new storage gear and software on a regular basis. Most cloud services provide you a large storage space where you may keep all of your important data. Even if you use it all, you can always upgrade to more secure cloud storage.

3. Backup and Recovery:

Data loss may have a severe impact on your organization. You might lose vital information, which could cost you a lot of money, waste your time, and harm your brand’s reputation. Cloud backup is a service that backs up and stores data and apps on a business’s servers on a distant server. In the case of a system malfunction, shutdown, or natural catastrophe, businesses choose to back up to the cloud to keep files and data accessible. You may have all of your data automatically backed up to the cloud on a routine basis. Moreover, the majority of cloud service providers are typically capable of handling data recovery. Because you save all of your data on the cloud, backing it up and recovering it is easier than storing it on a physical device. Consumers can do this on their own private or corporate servers, but cloud-service providers do it automatically and without the need for users to think about it. As a result, compared to other traditional data storage techniques, the backup and recovery procedure is more easier.

4. Increased Automation:   

Software integration in the cloud is typically something that happens naturally. Also, if you employ cloud-based apps, they will be automatically updated without the users’ input. You won’t have to put in any extra work to personalize and integrate your apps according to your preferences. This is normally taken care of on its own. You may even handpick the services and software applications that you believe would work best for your company. Updating a system on a regular basis may be a difficult undertaking. Every individual’s system must be updated by the IT department, which not only consumes time but also reduces productivity. Cloud computing goes a long way in streamlining these routine updates, allowing your staff to focus on the tasks that propel your company ahead.

What are the Disadvantages of Cloud Computing?

1. Limited Control and Flexibility:

Cloud computing makes management easier within a company. Whenever hardware is purchased or upgraded, the entire process involves several administrative duties that consume a significant amount of time. When it comes to cloud services, all you have to do is evaluate the finest cloud service providers and their plans, then choose the one that best meets your needs. The company’s modest IT department, which it can afford to recruit, will focus only on end-user experience management. Because the majority of the other work, such as maintainability, is handled off-site, you can be assured that your IT infrastructure will be managed effectively at all times. Hence, in the cloud, your system maintenance duties are also removed. These are all left to the cloud service. Your sole criterion is that you have faith in your provider to complete the task on a consistent basis. Cloud resources are available from anywhere on the planet, at any time, on any device, and you have total control over them.

2. Dependence on Internet Connectivity:

Because cloud infrastructure is owned, managed, and regulated entirely by the service provider, cloud customers have less influence over the operation and execution of services within it. Customers maintain control over their apps, data, and services, but may not have the same amount of control over their backend infrastructure, such as firmware updates and management or server shell access. The end-user license agreement (EULA) and management policies of a cloud provider may place restrictions on what customers may do with their deployments. It specifies what restrictions the supplier can impose on your deployment use. Even if it doesn’t enable you to change the architecture in any manner, all authorized cloud computing companies provide your company control over its apps and data.

3. Cloud Downtime:

One of the most common criticisms about cloud computing is that it causes downtime. Unfortunately, no company is exempt, particularly when vital business activities cannot afford to be disrupted. The vulnerability of public clouds is that everyone has access to the same server, which increases the danger of attack and slows down the server. Furthermore, because the cloud necessitates a high internet connection and adequate capacity, there is always the risk of a service interruption, which might result in company downtime. Today, no company can afford to lose money due to a disruption in vital business operations. You should prepare for cloud outages and business interruptions. Attempt to reduce the negative impact and provide the highest degree of service availability for your customers and employees.

Takeaway:

The benefits of putting data on the cloud are difficult to miss, but are the drawbacks expected to be dismissed as well? To be fair, companies must do a thorough analysis of their infrastructure and requirements. However, the advantages of cloud computing outnumber the downsides by a large margin. Cloud computing is a managed service that may help businesses of all sizes save time and money.

Why choose Python for your startup? Marketing October 14, 2021

Python is a programming language that has some of the most variety among its coding peers. It’s a dynamically structured, interpreted, object-oriented strong programming language. In recent decades, it has become one of the most widely used programming languages on the market. Python is used in conjunction with an interpreter, which runs the finished lines of code. It’s applied in a variety of applications, including machine learning, website development, data analysis, and test automation. It is suitable for both developers and non-developers.

Is Python a programming language or a scripting language? 

To respond to this topic, one must first understand the distinction between programming and scripting languages. All scripting languages are considered programming languages in nature. The sole distinction is that the scripting language is readily interpreted and does not necessitate compilation. Because compiled codes are converted into native machine programs, they run faster than interpreted codes. We can also create a programming interpreter and utilize it as a scripting language. Regarded as one of the most popular computer languages, Python makes for both, a programming language as well as a scripting language. Its code is translated and executed using an interpreter. This justifies Python as a scripting language. Python has also gained popularity because of the ease it provides to users. One can begin their career immediately with python. Python offers a variety of development choices, including object-relational mapping, multiprocessing, and web programming. Python is a programming language that is widely used. Python has already been adopted by several sectors. Python is attempting to accomplish both development and scripting duties.

Features of Python: 

The dynamic, free open source programming language has a lot of features that are worth mentioning. Some of them include: 

1. Smooth Integration:

Python is, by definition, an integrated language. This means that the Python interpreter runs each line of code separately. There arises no need to build Python code which makes debugging considerably easier and efficient.

2. Supports Test-driven development:

Before designing the real code, TDD advocates writing tests that verify the functioning of your code. Only once you’re satisfied with your testing and the features they test should you start writing actual code to meet the conditions required by the test that will allow it to pass. Python supports TDD and makes the process smooth and efficient. 

3. Provides a wide range of standard libraries:

Python helps control the firms’ development costs as it comes with a large number of pre-built libraries and frameworks that are available for free. Developers have free access to these libraries and frameworks. This helps them create strong software in a quick, cost-effective, and efficient manner.

4. Ideal for ML and Big Data:

The Data processing speed offered by Python makes it more than ideal for Big Data applications. Due to its simple syntax and convenient code, Python routines are run at a relatively short time required by other computer languages.

Reasons that make Python an Ideal Choice for a Start-up: 

Python has to offer many features that will help reduce your burden and ease your workload. Here are some of the reasons why you should consider Python for your start-up

1. Scalable:

Python offers features like multi-programming paradigm support and interpreted language, which makes it scalable. It accommodates a variety of programming paradigms, including object-oriented, reactive, and algorithmic programming. Python is a good language for businesses since it supports a variety of programming paradigms. Python is an interpreted language that allows developers to easily construct scripts and code on a bigger scale. As a result, the time of the project is cut in half.

2. User-friendly:

Python is among the most straightforward and easy-to-understand programming languages. It is because of its clean, organized, and unambiguous syntax, it is simple to use and learn. Its code is quite understandable and equivalent to the English language. Python is a very simple language to learn relative to other programming languages such as C++, Javascript, and Java. Python is a fairly simple program to code with, and anyone can learn the basics within a few hours or days. As a result, it’s language-friendly to the development community. Developers can easily examine, analyze, and modify Python code. This shortens the number of apps by speeding up the research and deployment process.

3. Versatile:

Python can operate on a variety of platforms that includes Windows, Linux, UNIX, and Macintosh. As a result, we may conclude that Python is a versatile programming language. It allows programmers to create software for several rival platforms by creating only one program. Python is one of the most versatile programming languages in the business since it is built-in C and permits the execution of code written in other programming languages such as Java, C, and C#. Other programming languages do not allow for this, making Python one of the most versatile and portable languages on the market.

4. Is open-source and free:

Being an open-source programming language, Python can be improved and developed by anyone. An online community where thousands of developers meet every day to discuss how they can modify the language for the better. The Open Source Action plan has verified all recent iterations of Python, and they are all copyrighted under a GPL compatible license. This means that you can use Python’s infrastructure without having to shell out more money.

Conclusion:

Python has become a popular and widely used programming language because of features such as its flexibility, ease of use nature, versatility, security, etc. This makes it a popular choice for startups as it provides efficient results with minimum effort. 

Analyze sales compensation payout sensitivity using python (Jupyter) Sujeet Pillai June 20, 2014


Introduction

A critical component of sales compensation plan design is testing the plan against various scenarios of the sales performance of individual salespeople. Typically a newly designed sales compensation plan is tested against historical sales performance to gauge how the new compensation plan would payout if it had been implemented in the previous plan period. While using historical performance can help, it’s also important to test it against a randomized sales performance set to check the sensitivity of your payouts to sales variations. When your sales compensation plan rolls out, it typically affects sales rep behavior, and we must ensure that such changes don’t result in any budgetary surprises. This is also a good analysis to run on a periodic basis to estimate the risk to your sales compensation budgets from any unforeseen market events.

Python and IPython

Such sensitivity analysis requires a large number of repeated sales compensation calculations and an ability to quickly introduce randomness, variation, etc., to generate data scenarios. Traditionally Excel has been used for similar analyses. However, with the volume of calculations and looping constraints, the entire process becomes very cumbersome. Python with the numpy library is perfect for such data manipulation. Matplotlib is the visualization tool of choice to be used in combination with IPython.

IPython is a powerful interactive python shell with support for rich data visualization. Specifically, the IPython notebook is a browser-based IPython shell with support for in-browser data visualizations and embedding rich media. We will use the IPython notebook for this analysis to take advantage of the in-browser visualizations that are offered.

Here is some help on how to set up IPython on your computer to try out.

IPython setup

First, let’s set up IPython for the needs of our analysis.

# start IPython notebook
IPython notebook

This should open up a list of notebooks in the current working directory. Create a new notebook by clicking “New Notebook”.

Let’s use IPython magic commands to set up our IPython environment such that all graphs are plotted in the browser.

#Use in browser graphs
%matplotlib inline

Also, let’s import all the python libraries we’ll be using for this exercise.

import numpy
import matplotlib
import CompUtils

The Plan

Let’s assume that the compensation plan setup is a payout curve of revenue achievement to a payout percentage. The related table is given below:

Revenue AchievementPayout Percentage 0%0% 50%35% 80%75% 100%100% 120%150% 300%500%

The points in between consecutive revenue achievement points are interpolated linearly between the payout percentages.

Let’s initialize the plan in our IPython notebook

 # Initialize Rate Table
 payout_table = CompUtils.Rate_Table()
 payout_table.add_row(0,0)
 payout_table.add_row(0.5,0.35)
 payout_table.add_row(0.8,0.75)
 payout_table.add_row(1.0,1.0)
 payout_table.add_row(1.2,1.5)
 payout_table.add_row(3.0,5.0)

Inputs

Next, let’s set up some salesforce attributes. Let’s assume that the salesforce has 1000 sales reps, each with a Target Incentive of $5,000 per month. Let’s also assume that their revenue goal is $10,000 per month.

number_of_reps = 1000
target_incentive = 5000
revenue_goal = 10000

Now we’re ready to set up the simulation. For revenue, we’re going to assume that these 1000 sales reps perform at a mean sales revenue of $11,000 with a $4,000 standard deviation.

mean_sales_revenue_of_population = 11000
std_dev_sales_revenue = 4000

Simulation

The next step is to run the actual simulation. We’ll set it up so that these steps are followed: – the sales revenue for 1000 reps will be randomized around the mean and standard deviation, – their achievement of goal will be calculated – their payout % looked up on the curve – their final payout calculated as the product of payout % and target incentive.

sales_revenue = numpy.random.normal(mean_sales_revenue_of_population,std_dev_sales_revenue,
number_of_reps) # Randomized set of sales revenue
revenue_achievement = sales_revenue/revenue_goal # Revenue achievement set of population
payout_pct = CompUtils.calculate_lookup_attainment(revenue_achievement,payout_table.rows)
rep_payout = payout_pct * target_incentive
total_salesforce_payout = numpy.sum(rep_payout)
print 'Total Salesforce Payout = %d' % total_salesforce_payout

This would print something like:

Total Salesforce Payout = 6675583

Ok, so we’ve run the simulation using a random set of sales revenue inputs and calculated the total salesforce payout. However, that Total salesforce payout number would keep changing as the random sales revenue input set changes. Hence let’s run this simulation repeatedly, say 100 times, and then summarize the results from those 100 runs. How do we do that? Let’s refactor the above code as follows:

iterations_array = []
for i in range(100):
    # Randomized set of sales revenue
    sales_revenue = numpy.random.normal(mean_sales_revenue_of_population,std_dev_sales_revenue,number_of_reps)
    revenue_achievement = sales_revenue/revenue_goal # Revenue achievement set of population
    payout_pct = CompUtils.calculate_lookup_attainment(revenue_achievement,payout_table.rows)
    rep_payout = payout_pct * target_incentive
    total_salesforce_payout = numpy.sum(rep_payout)
    iterations_array.append(total_salesforce_payout)

That was easy. Basically, we created an array to store the result from each iteration and pushed the total_salesforce_payout into that array. Let’s now visualize the results and derive some useful statistics out of these iterations:

matplotlib.pyplot.hist(iterations_array,bins=20,color='green')
print 'Mean Total Salesforce Payout = %d' % numpy.mean(iterations_array)
print 'Median Total Salesforce Payout = %d' % numpy.median(iterations_array)
print 'Standard Deviation Total Salesforce Payout = %d' % numpy.std(iterations_array)
print 'Max Total Salesforce Payout = %d' % numpy.max(iterations_array)
print 'Min Total Salesforce Payout = %d' % numpy.min(iterations_array)

This should produce an output as follows:


Mean Total Salesforce Payout = 6657248
Median Total Salesforce Payout = 6645881
Standard Deviation Total Salesforce Payout = 117827
Max Total Salesforce Payout = 6963018
Min Total Salesforce Payout = 6385194

Excellent, so for that run, we’ve identified the range of possible payouts, the mean, the median, and the deviation potential of the total salesforce payouts. The distribution graph shows where the total payouts of the 100 iterations we performed landed.

Sensitivity

Our simulation now shows the variation possible in the payouts as a result of random sales revenue performance inputs. We can tweak this simulation by increasing the standard deviation on the sales revenue inputs to analyze the effect on the total payout. Similarly, we can also gauge the change in the total payout with a variation in the mean of the sales revenue randomized input. That will display our plan payout’s sensitivity to variations in sales performance.

Let’s refactor our code to introduce a sales increase factor and then run our simulation again. We’ll basically multiply the mean of the sales revenue input by this factor before calculating the randomized input. Effectively we’re going to test the sensitivity of plan payout to 2%, 5%, 7%, 12%, 15%, 18%, 20%, and 25% increases in mean sales.

results_array = []
sales_increase_factor_list = [0.02, 0.05, 0.07, 0.12, 0.15, 0.18, 0.2, 0.25]

for sales_increase_factor in sales_increase_factor_list:
    iterations_array = []
    for i in range(100):
        # Randomized set of sales revenue
        sales_revenue = numpy.random.normal(mean_sales_revenue_of_population*(1+sales_increase_factor),std_dev_sales_revenue,number_of_reps)
        revenue_achievement = sales_revenue/revenue_goal # Revenue achievement set of population
        payout_pct = CompUtils.calculate_lookup_attainment(revenue_achievement,payout_table.rows)
        rep_payout = payout_pct * target_incentive
        total_salesforce_payout = numpy.sum(rep_payout)
        iterations_array.append(total_salesforce_payout)
    results_array.append(dict(sales_increase_factor=sales_increase_factor,
                                mean=numpy.mean(iterations_array),
                                median=numpy.median(iterations_array),
                                std=numpy.std(iterations_array),
                                max=numpy.max(iterations_array),
                                min=numpy.min(iterations_array)))

Ok, so we’ve run the simulation for each value in the sales increases factor list. Now let’s plot and display our results.

# Set up matplotlib options

matplotlib.pyplot.figure(figsize=(9,6))
font = {'family' : 'Arial',
        'weight' : 'normal',
        'size'   : 14}

matplotlib.rc('font', **font)

# Plot lines
matplotlib.pyplot.plot(map(lambda x:x['sales_increase_factor'],results_array),
                       map(lambda x:x['mean'],results_array),label='mean',lw=2)
matplotlib.pyplot.plot(map(lambda x:x['sales_increase_factor'],results_array),
                       map(lambda x:x['min'],results_array),label='min',ls='-.')
matplotlib.pyplot.plot(map(lambda x:x['sales_increase_factor'],results_array),
                       map(lambda x:x['max'],results_array),label='max',ls='-.')

# Set up plot options
matplotlib.pyplot.legend(loc=3)
# matplotlib.pyplot.axis(ymin=0)
matplotlib.pyplot.ticklabel_format(style='sci', axis='y', scilimits=(0,999999999))
matplotlib.pyplot.xlabel('Sales Increase Factor')
matplotlib.pyplot.ylabel('Total Salesforce Payout')

# Display in table form
from IPython.display import HTML
html='''<table>
            <thead>
                <th>Sales Increase Factor</th>
                <th>Mean Total Payout</th>
                <th>Max Total Payout</th>
                <th>Min Total Payout</th>
                <th>Increase in Payout</th>
            </thead>
'''

formatted_numbers = map(lambda x:['{:.0%}'.format(x['sales_increase_factor']),'${:,.0f}'.format(x['mean']),'${:,.0f}'.format(x['max']),'${:,.0f}'.format(x['min']),'{:.0%}'.format((x['mean']/results_array[0]['mean'])-1)],results_array)
# print formatted_numbers
html = html+(''.join(map(lambda x: '<tr><td>'+('</td><td style="text-align:right">'.join(x))+'</td></tr>',formatted_numbers)))+'</table>'
HTML(html)

This should generate an output that looks like this:

Sales Increase FactorMean Total PayoutMax Total PayoutMin Total PayoutIncrease in Payout 0%$6,661,012$6,936,747$6,355,4510%2%$6,855,002$7,128,312$6,661,2553%5%$7,123,175$7,344,958$6,799,0927%7%$7,346,115$7,599,005$7,072,25810%12%$7,859,148$8,091,215$7,560,60418%15%$8,161,052$8,491,135$7,831,55323%18%$8,461,816$8,754,745$8,233,40027%20%$8,657,557$8,924,484$8,347,14030%25%$9,188,707$9,437,714$8,940,52938%

Let’s look at the results. It shows that at an $11k sales revenue mean with a $4k standard deviation, your comp plan is likely to pay a mean payout of about $6.6M with a max of $6.9M and a min of $6.3M. As your sales performance improves this number obviously goes up. For a 12% increase in sales, your plan is expected to pay about $7.85M on average (max of $8.09M and min of $7.56M).

That represents an 18% increase in payout for a 12% increase in sales performance. That is the estimate of your compensation plan’s sensitivity.

Our sensitivity scenarios were quite straightforward. We basically multiplied by a straight factor to improve your sales performance. However, these scenarios can be as complex as the questions you’d like to ask of the data. For Example:

What if in response to my new compensation plan, the top 20% of my salesforce did not change their performance however the next quintile improved their sales performance by 10% and the third quintile by 35%. What would the effect on my total payout?

Such questions are easy to analyze once you have a basic sensitivity model as we have set up. The advantage of using python in such a case is it’s easy to swap scenario types without much rework.

You can download all the codes here

To learn more about Incentius capabilities, visit our data analytics page

Do you need additional help with sales compensation plan design/testing for your company? Please email us at info@incentius.com

And if you got this far, we think you’d like our future blog content, too. Please subscribe on the right side.


Sales compensation modeling and analytics in Python Sujeet Pillai January 9, 2014


Introduction

Over the past few years, python has grown into a serious scientific computing language. This owes itself to several mathematical packages like NumPy, scipy, and pandas maturing and being trusted by the scientific community. These packages and the inherent simplicity of python had a democratizing effect on the ability to perform complex mathematical modeling without expensive proprietary software.

In this blog post, I wish to utilize these techniques that are commonplace in the scientific community to try and apply them to the sales compensation/analytics domain. I’m going to attempt to model a basic sales compensation plan using NumPy and python. The intent is to keep the model simple and to get it up and running fast. Future blog posts will introduce more complex elements and more advanced modeling techniques. The hope is that this basic model will demonstrate the power of these python-based modeling techniques and their simplicity.

The Interface

Firstly, let’s settle on an input/output interface. I believe business users are still some way off from setting parameters/data in formats like JSON/XML/YAML. This eliminates those possibilities. As most of us are used to Excel (more than we like to admit), I’d like to keep the input/output interface as Excel. I’d like the model to read inputs and parameters from Excel and write the final results into an output sheet on Excel. Python luckily has an excellent package called openpyxl that allows it to interface with an Excel file (Excel 2007 onwards only). We’ll use this package to read our inputs and parameters and to write the outputs of our model. DataNitro and Pyxll are two other python packages you can use for interfacing with Excel; however, they run as an addition to Excel rather than as an independent python package.

The Plan

I’ve chosen a very simple Achievement vs Attainment Payout Table for the purposes of this model. I’ve created a named range “PayoutTable” in my excel file (named “plan_modeling.xlsx”) containing this payout table.

I’m going to assume a simple payout table with linearly interpolated attainment between two subsequent performance levels. Below is a graphical look at my payout curve. The slope of the line above the highest performance level defined in the table is determined by the “Infinity Rate” Parameter

Curve

The Target Incentive Dollars for the given class of reps is defined using the “TIC” parameter.

Earnings for the plan will be calculated as the attainment as calculated using the payout table based on the achievement times of the Target Incentive.

Simulation Parameters

To simulate the performance of a salesforce on this plan I’m going to use a normal distribution of achievements around some mean and standard deviation. These parameters are defined in my Excel file as “AverageAchievement”, and “StdDevAchievement”. The sample size of the population of sales reps that I use to model this plan is defined by the “SampleSize” parameter. Overall the plan and simulation parameters section looks like the following.

Inputs

Model Setup

Alright! Time to write some code!!

First, let’s import the required packages. Numpy and openpyxl

#!python
import numpy
import openpyxl
from openpyxl.style import NumberFormat

I’ve created two helper packages. openpyxl_helpers has methods for frequently used interactions with the excel file using the openpyxl library. CompUtils sets up a Rate_Table class to maintain a payout table and has a method to apply the rate table to an achievement distribution

#!python
import CompUtils
from openpyxl_helpers import *

Open the workbook using openpyxl

#!python
# Open workbook
wb = openpyxl.load_workbook('plan_modeling.xlsx')

Pull in all the plan and simulation parameters from the excel file using their named ranges.

#!python
# Read plan parameters
payout_table_range = read_table_from_named_range(wb,'PayoutTable')
infinity_rate = read_value_from_named_range(wb,'InfinityRate')
TIC = read_value_from_named_range(wb,'TIC')

# Read simulation parameters
average_achievement = read_value_from_named_range(wb,'AverageAchievement')
std_achievement = read_value_from_named_range(wb,'StdDevAchievement')
sample_size = read_value_from_named_range(wb,'SampleSize')

Next, we’ll initialize the Rate_Table class from our helper package CompUtils. We’ll add all rows from the payout_table_range that we read from the excel file and then set the infinity rate parameter. The Rate_Table class expects the lookup field to be called ‘start’ and the value field to be called ‘base’. Since we’ve used ‘achievement’ and ‘attainment’ instead, we’ll override those names by passing startKey and base key.

#!python
# Initialize Rate Table
payout_table = CompUtils.Rate_Table()
payout_table.add_row_list(payout_table_range,startKey='achievement',baseKey='attainment')
payout_table.set_infinity_rate(infinity_rate)

Finally, all our parameters have been retrieved, our rate table has been set up. Now we’re ready to do some modeling. Let’s first generate the achievement sample using our simulation parameters. We’ll use the numpy.random.normal function.

#!python
# Populate the achievement sample
achievement_distribution = numpy.random.normal(average_achievement,std_achievement,sample_size)

Now calculate the attainment for this achievement sample by applying the rate table to it.

#!python
# Calculate Attainment based on the Payout Table
attainment = CompUtils.calculate_lookup_attainment(achievement_distribution,payout_table.rows)

Calculate earnings by multiplying the attainment values against TIC. Note that the attainment is a numpy.ndarray and is being multiplied by a scalar TIC. Numpy allows us to do such multiplications simply and it inherently understands how to handle such an operation.

#!python
# Calculate Earnings as Attainment times Target Incentive
earnings = attainment * TIC

And that’s it. We’ve already calculated earnings for all reps in the sample. And it took all 3 lines of code for the full model!! Now let’s write some of our results out in excel.

#!python
# Create an output sheet for us to write to
output_ws = wb.create_sheet(title='Output')

# Write Achievement, Attainment and Earnings into columns
write_list_of_values(output_ws,'A1',list(achievement_distribution),'Achievement',number_format=NumberFormat.FORMAT_PERCENTAGE_00)
write_list_of_values(output_ws,'B1',list(attainment),'Attainment',number_format=NumberFormat.FORMAT_PERCENTAGE_00)
write_list_of_values(output_ws,'C1',list(earnings),'Earnings',number_format=NumberFormat.FORMAT_CURRENCY_USD_SIMPLE)

That gave us the raw values of the achievement sample, attainment, and earnings of that sample. Now let’s create some more useful analytical tables. The openpyxl_helpers package has a couple of predefined methods to help create a quick distribution table and some statistics in a stats table. Let’s add those to our output sheet now.

#!python
# Create a Distribution Table
create_distribution_table(output_ws,'E1',earnings,number_format=NumberFormat.FORMAT_CURRENCY_USD_SIMPLE)

# Create a Stats Table
create_stats_table(output_ws,'I1',earnings,number_format=NumberFormat.FORMAT_CURRENCY_USD_SIMPLE)

Finally, let’s write the output to a new file.

#!python
# Write the output to a new file
wb.save(filename='/home/sujeet/Desktop/plan_modeling_simulated.xlsx')

Our newly generated output file should have a new sheet called “Output” with data like the below screenshot. The stats table gives us some useful metrics, and the distribution table can be used to plot a bell curve of the rep’s earnings.

Outputs

The tip of the iceberg

This is a very basic model. My intent was only to display how painless it is to use python, NumPy, etc., to create a basic sales compensation/analytics model. This code can be adapted to perform analysis on a complex model just as easily. Imagine the potential in quota-setting models, territory alignments, call planning, etc.

You can get the code for this whole model, including the helper packages, at sujeetpillai/simple_python_comp_model

Incentius can help create, maintain, and tweak such models to achieve your business goals. This is a zone that we’re very excited about, and we can’t wait to help you realize the potential for such techniques!

How did you like this blog post? Let us know in the comments below or on our social media pages.

If you got this far, we think you’d like our future blog content, too. Please subscribe on the right side.