Introduction
A critical component of sales compensation plan design is testing the plan against various scenarios of the sales performance of individual salespeople. Typically a newly designed sales compensation plan is tested against historical sales performance to gauge how the new compensation plan would payout if it had been implemented in the previous plan period. While using historical performance can help, it's also important to test it against a randomized sales performance set to check the sensitivity of your payouts to sales variations. When your sales compensation plan rolls out, it typically affects sales rep behavior, and we must ensure that such changes don't result in any budgetary surprises. This is also a good analysis to run on a periodic basis to estimate the risk to your sales compensation budgets from any unforeseen market events.
Python and IPython
Such sensitivity analysis requires a large number of repeated sales compensation calculations and an ability to quickly introduce randomness, variation, etc., to generate data scenarios. Traditionally Excel has been used for similar analyses. However, with the volume of calculations and looping constraints, the entire process becomes very cumbersome. Python with the numpy library is perfect for such data manipulation. Matplotlib is the visualization tool of choice to be used in combination with IPython.
IPython is a powerful interactive python shell with support for rich data visualization. Specifically, the IPython notebook is a browser-based IPython shell with support for in-browser data visualizations and embedding rich media. We will use the IPython notebook for this analysis to take advantage of the in-browser visualizations that are offered.
Here is some help on how to set up IPython on your computer to try out.
IPython setup
First, let's set up IPython for the needs of our analysis.
# start IPython notebook
IPython notebook
This should open up a list of notebooks in the current working directory. Create a new notebook by clicking "New Notebook".
Let's use IPython magic commands to set up our IPython environment such that all graphs are plotted in the browser.
#Use in browser graphs
%matplotlib inline
Also, let's import all the python libraries we'll be using for this exercise.
import numpy
import matplotlib
import CompUtils
The Plan
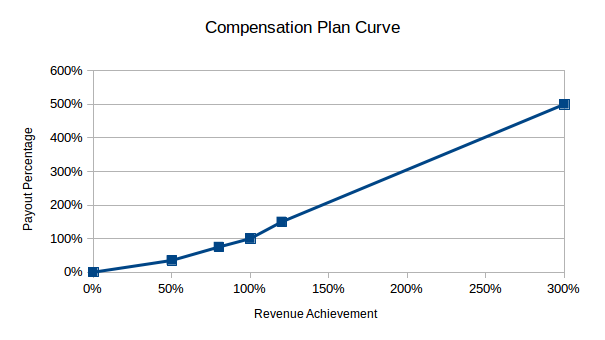
Let's assume that the compensation plan setup is a payout curve of revenue achievement to a payout percentage. The related table is given below:
Revenue AchievementPayout Percentage 0%0% 50%35% 80%75% 100%100% 120%150% 300%500%

The points in between consecutive revenue achievement points are interpolated linearly between the payout percentages.
Let's initialize the plan in our IPython notebook
# Initialize Rate Table
payout_table = CompUtils.Rate_Table()
payout_table.add_row(0,0)
payout_table.add_row(0.5,0.35)
payout_table.add_row(0.8,0.75)
payout_table.add_row(1.0,1.0)
payout_table.add_row(1.2,1.5)
payout_table.add_row(3.0,5.0)
Inputs
Next, let's set up some salesforce attributes. Let's assume that the salesforce has 1000 sales reps, each with a Target Incentive of $5,000 per month. Let's also assume that their revenue goal is $10,000 per month.
number_of_reps = 1000
target_incentive = 5000
revenue_goal = 10000
Now we're ready to set up the simulation. For revenue, we're going to assume that these 1000 sales reps perform at a mean sales revenue of $11,000 with a $4,000 standard deviation.
mean_sales_revenue_of_population = 11000
std_dev_sales_revenue = 4000
Simulation
The next step is to run the actual simulation. We'll set it up so that these steps are followed: - the sales revenue for 1000 reps will be randomized around the mean and standard deviation, - their achievement of goal will be calculated - their payout % looked up on the curve - their final payout calculated as the product of payout % and target incentive.
sales_revenue = numpy.random.normal(mean_sales_revenue_of_population,std_dev_sales_revenue,
number_of_reps) # Randomized set of sales revenue
revenue_achievement = sales_revenue/revenue_goal # Revenue achievement set of population
payout_pct = CompUtils.calculate_lookup_attainment(revenue_achievement,payout_table.rows)
rep_payout = payout_pct * target_incentive
total_salesforce_payout = numpy.sum(rep_payout)
print 'Total Salesforce Payout = %d' % total_salesforce_payout
This would print something like:
Total Salesforce Payout = 6675583
Ok, so we've run the simulation using a random set of sales revenue inputs and calculated the total salesforce payout. However, that Total salesforce payout number would keep changing as the random sales revenue input set changes. Hence let's run this simulation repeatedly, say 100 times, and then summarize the results from those 100 runs. How do we do that? Let's refactor the above code as follows:
iterations_array =
for i in range(100):
# Randomized set of sales revenue
sales_revenue = numpy.random.normal(mean_sales_revenue_of_population,std_dev_sales_revenue,number_of_reps)
revenue_achievement = sales_revenue/revenue_goal # Revenue achievement set of population
payout_pct = CompUtils.calculate_lookup_attainment(revenue_achievement,payout_table.rows)
rep_payout = payout_pct * target_incentive
total_salesforce_payout = numpy.sum(rep_payout)
iterations_array.append(total_salesforce_payout)
That was easy. Basically, we created an array to store the result from each iteration and pushed the total_salesforce_payout into that array. Let's now visualize the results and derive some useful statistics out of these iterations:
matplotlib.pyplot.hist(iterations_array,bins=20,color='green')
print 'Mean Total Salesforce Payout = %d' % numpy.mean(iterations_array)
print 'Median Total Salesforce Payout = %d' % numpy.median(iterations_array)
print 'Standard Deviation Total Salesforce Payout = %d' % numpy.std(iterations_array)
print 'Max Total Salesforce Payout = %d' % numpy.max(iterations_array)
print 'Min Total Salesforce Payout = %d' % numpy.min(iterations_array)
This should produce an output as follows:

Mean Total Salesforce Payout = 6657248
Median Total Salesforce Payout = 6645881
Standard Deviation Total Salesforce Payout = 117827
Max Total Salesforce Payout = 6963018
Min Total Salesforce Payout = 6385194
Excellent, so for that run, we've identified the range of possible payouts, the mean, the median, and the deviation potential of the total salesforce payouts. The distribution graph shows where the total payouts of the 100 iterations we performed landed.
Sensitivity
Our simulation now shows the variation possible in the payouts as a result of random sales revenue performance inputs. We can tweak this simulation by increasing the standard deviation on the sales revenue inputs to analyze the effect on the total payout. Similarly, we can also gauge the change in the total payout with a variation in the mean of the sales revenue randomized input. That will display our plan payout's sensitivity to variations in sales performance.
Let's refactor our code to introduce a sales increase factor and then run our simulation again. We'll basically multiply the mean of the sales revenue input by this factor before calculating the randomized input. Effectively we're going to test the sensitivity of plan payout to 2%, 5%, 7%, 12%, 15%, 18%, 20%, and 25% increases in mean sales.
results_array =
sales_increase_factor_list =
for sales_increase_factor in sales_increase_factor_list:
iterations_array =
for i in range(100):
# Randomized set of sales revenue
sales_revenue = numpy.random.normal(mean_sales_revenue_of_population*(1+sales_increase_factor),std_dev_sales_revenue,number_of_reps)
revenue_achievement = sales_revenue/revenue_goal # Revenue achievement set of population
payout_pct = CompUtils.calculate_lookup_attainment(revenue_achievement,payout_table.rows)
rep_payout = payout_pct * target_incentive
total_salesforce_payout = numpy.sum(rep_payout)
iterations_array.append(total_salesforce_payout)
results_array.append(dict(sales_increase_factor=sales_increase_factor,
mean=numpy.mean(iterations_array),
median=numpy.median(iterations_array),
std=numpy.std(iterations_array),
max=numpy.max(iterations_array),
min=numpy.min(iterations_array)))
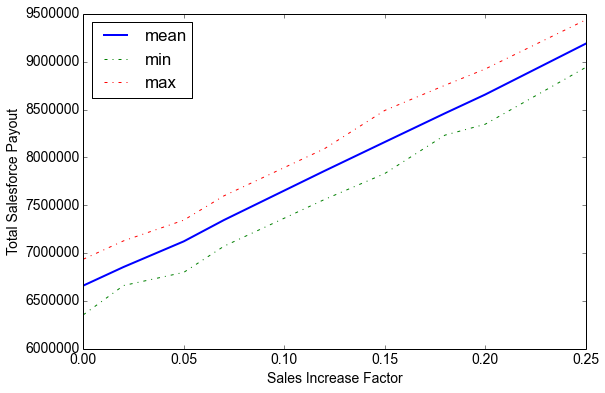
Ok, so we've run the simulation for each value in the sales increases factor list. Now let's plot and display our results.
# Set up matplotlib options
matplotlib.pyplot.figure(figsize=(9,6))
font = {'family' : 'Arial',
'weight' : 'normal',
'size' : 14}
matplotlib.rc('font', **font)
# Plot lines
matplotlib.pyplot.plot(map(lambda x:x,results_array),
map(lambda x:x,results_array),label='mean',lw=2)
matplotlib.pyplot.plot(map(lambda x:x,results_array),
map(lambda x:x,results_array),label='min',ls='-.')
matplotlib.pyplot.plot(map(lambda x:x,results_array),
map(lambda x:x,results_array),label='max',ls='-.')
# Set up plot options
matplotlib.pyplot.legend(loc=3)
# matplotlib.pyplot.axis(ymin=0)
matplotlib.pyplot.ticklabel_format(style='sci', axis='y', scilimits=(0,999999999))
matplotlib.pyplot.xlabel('Sales Increase Factor')
matplotlib.pyplot.ylabel('Total Salesforce Payout')
# Display in table form
from IPython.display import HTML
html='''<table>
<thead>
<th>Sales Increase Factor</th>
<th>Mean Total Payout</th>
<th>Max Total Payout</th>
<th>Min Total Payout</th>
<th>Increase in Payout</th>
</thead>
'''
formatted_numbers = map(lambda x:),'${:,.0f}'.format(x),'${:,.0f}'.format(x),'${:,.0f}'.format(x),'{:.0%}'.format((x/results_array)-1)],results_array)
# print formatted_numbers
html = html+(''.join(map(lambda x: '<tr><td>'+('</td><td style="text-align:right">'.join(x))+'</td></tr>',formatted_numbers)))+'</table>'
HTML(html)
This should generate an output that looks like this:
Sales Increase FactorMean Total PayoutMax Total PayoutMin Total PayoutIncrease in Payout 0%$6,661,012$6,936,747$6,355,4510%2%$6,855,002$7,128,312$6,661,2553%5%$7,123,175$7,344,958$6,799,0927%7%$7,346,115$7,599,005$7,072,25810%12%$7,859,148$8,091,215$7,560,60418%15%$8,161,052$8,491,135$7,831,55323%18%$8,461,816$8,754,745$8,233,40027%20%$8,657,557$8,924,484$8,347,14030%25%$9,188,707$9,437,714$8,940,52938%

Let's look at the results. It shows that at an $11k sales revenue mean with a $4k standard deviation, your comp plan is likely to pay a mean payout of about $6.6M with a max of $6.9M and a min of $6.3M. As your sales performance improves this number obviously goes up. For a 12% increase in sales, your plan is expected to pay about $7.85M on average (max of $8.09M and min of $7.56M).
That represents an 18% increase in payout for a 12% increase in sales performance. That is the estimate of your compensation plan's sensitivity.
Our sensitivity scenarios were quite straightforward. We basically multiplied by a straight factor to improve your sales performance. However, these scenarios can be as complex as the questions you'd like to ask of the data. For Example:
What if in response to my new compensation plan, the top 20% of my salesforce did not change their performance however the next quintile improved their sales performance by 10% and the third quintile by 35%. What would the effect on my total payout?
Such questions are easy to analyze once you have a basic sensitivity model as we have set up. The advantage of using python in such a case is it's easy to swap scenario types without much rework.
You can download all the codes here
To learn more about Incentius capabilities, visit our data analytics page
Do you need additional help with sales compensation plan design/testing for your company? Please email us at info@incentius.com
And if you got this far, we think you’d like our future blog content, too. Please subscribe on the right side.


