IPL Special Blog: Analyzing team performance
IPL season is upon us, and the madness is in full flow. Along with the IPL comes the inevitable discussions on
which team is better, who is more consistent, etc. Here at Incentius, we want to take an analytical stab at this
question. How can we compare teams across the matches that they've played? Note that we want to look at overall
consistency and not just win performance. If a team loses a close match, it should still be rated higher than a
team that lost a match by a big difference. Similarly, winning teams should get more credit if they have a big
victory as opposed to those who have won close victories.
Normalizing scores
The core question here is one of normalizing scores in a game. We'll do it on a scale of 0-1. For example, if the team
A defeats team B in a match, team A would get a 'performance metric' of say, 0.60 and team B would receive a
performance metric of 0.4 (Hence adding up to 1). The greater the extent of the victory, the higher team A's metric
would be, and the lower team B's metric would be. The normalizing to 1.0 ensures that every game is equally
weighted. This is the approach we choose to take. If we wanted to weigh each game differentially, say by how long
back that game was, we could do that as well. Or we could weigh each game by the total performance of both teams.
That would give high scoring matches a higher weightage than low-scoring matches.
Measuring the extent of performance
The second question is how we define the extent of the victory. Obviously, the number of runs scored by a team
should be part of it. Similarly, the total number of wickets lost in an inning should be part of it. So a team
that scores 150 in an inning by losing 5 wickets in 12 overs is better than a team that scores 150 in an inning
by losing 7 wickets in 12 overs.
Strategy for measurement
So what strategy should we use for such measurement? Let's use the Duckworth-Lewis method in a reverse fashion. The
The Duckworth-Lewis method is a statistical method that estimates the number of runs an average cricket team is
expected to make based on the resources they have. In cricket, the 'resources' are the number
of overs to be bowled and the number of wickets in hand. Essentially Duckworth-Lewis is a matrix that contains a number
of wickets in hand on one axis and the number of overs left to be bowled on the other axis. The matrix values of
intersecting points tell you how many runs the team is expected to make. Read more about the Duckworth-Lewis
method and its application on its Wikipedia
page
The Duckworth-Lewis method is primarily used for 50 overs matches. However, luckily for us, Rianka Bhattacharya,
Paramjit S. Gill and Tim B. Swartz have calculated the T20 table for the same in their paper, available here. Here is their table:
| Overs/Wickets |
0 |
1 |
2 |
3 |
4 |
5 |
6 |
7 |
8 |
9 |
| 20 |
1 |
0.969 |
0.93 |
0.879 |
0.813 |
0.722 |
0.599 |
0.448 |
0.297 |
0.176 |
| 19 |
0.956 |
0.909 |
0.877 |
0.83 |
0.769 |
0.683 |
0.565 |
0.42 |
0.272 |
0.153 |
| 18 |
0.917 |
0.867 |
0.829 |
0.787 |
0.732 |
0.654 |
0.542 |
0.402 |
0.257 |
0.139 |
| 17 |
0.877 |
0.823 |
0.789 |
0.738 |
0.697 |
0.628 |
0.522 |
0.387 |
0.246 |
0.128 |
| 16 |
0.835 |
0.782 |
0.753 |
0.705 |
0.664 |
0.602 |
0.503 |
0.374 |
0.235 |
0.12 |
| 15 |
0.792 |
0.743 |
0.709 |
0.669 |
0.626 |
0.574 |
0.484 |
0.362 |
0.227 |
0.112 |
| 14 |
0.751 |
0.707 |
0.673 |
0.637 |
0.593 |
0.546 |
0.464 |
0.35 |
0.218 |
0.105 |
| 13 |
0.715 |
0.674 |
0.636 |
0.603 |
0.562 |
0.515 |
0.443 |
0.338 |
0.21 |
0.098 |
| 12 |
0.683 |
0.637 |
0.602 |
0.568 |
0.529 |
0.475 |
0.419 |
0.326 |
0.202 |
0.091 |
| 11 |
0.65 |
0.599 |
0.566 |
0.533 |
0.497 |
0.439 |
0.393 |
0.313 |
0.194 |
0.085 |
| 10 |
0.613 |
0.56 |
0.526 |
0.501 |
0.46 |
0.408 |
0.361 |
0.3 |
0.186 |
0.079 |
| 9 |
0.579 |
0.523 |
0.479 |
0.461 |
0.425 |
0.378 |
0.331 |
0.283 |
0.177 |
0.072 |
| 8 |
0.54 |
0.483 |
0.443 |
0.417 |
0.389 |
0.349 |
0.302 |
0.261 |
0.167 |
0.066 |
| 7 |
0.493 |
0.442 |
0.402 |
0.374 |
0.354 |
0.321 |
0.272 |
0.234 |
0.157 |
0.059 |
| 6 |
0.417 |
0.385 |
0.357 |
0.33 |
0.317 |
0.29 |
0.242 |
0.2 |
0.145 |
0.052 |
| 5 |
0.362 |
0.334 |
0.31 |
0.286 |
0.273 |
0.255 |
0.215 |
0.17 |
0.122 |
0.044 |
| 4 |
0.308 |
0.28 |
0.261 |
0.241 |
0.224 |
0.207 |
0.183 |
0.142 |
0.1 |
0.035 |
| 3 |
0.254 |
0.228 |
0.211 |
0.194 |
0.177 |
0.165 |
0.144 |
0.116 |
0.079 |
0.025 |
| 2 |
0.197 |
0.172 |
0.155 |
0.141 |
0.127 |
0.119 |
0.106 |
0.093 |
0.062 |
0.016 |
| 1 |
0.137 |
0.113 |
0.097 |
0.085 |
0.073 |
0.067 |
0.06 |
0.052 |
0.042 |
0.009 |
Calculating performance
Now, how do we use the Duckworth-Lewis table to calculate performance for a match? What we're going to do is
calculate an 'effective score' for each team. i.e. if a team finished their innings without using up all of their
wickets and all of their overs, we're going to argue that they could have used those remaining overs & wickets
to score extra runs. The D/L table defines the number of extra runs they could have made.
Hence, if in an inning a team is all out or finished all 20 overs:
effective_score = actual_score
If however, a team still has wickets in hand and overs left to play:
effective_score = actual_score + extra runs(Wickets in hand/Overs left -> looked up on D/L Table)
Once the effective_score of each team is calculated, we calculate the performance metric by using:
performance_metric_team_a = team_a_effective_score/(team_a_effective_score + team_b_effective_score)
Analyzing performance
Now that we've calculated the performance metric of every team for every match let's ask the data questions.
Consistency
Which teams have been most consistent across 2008-2014?
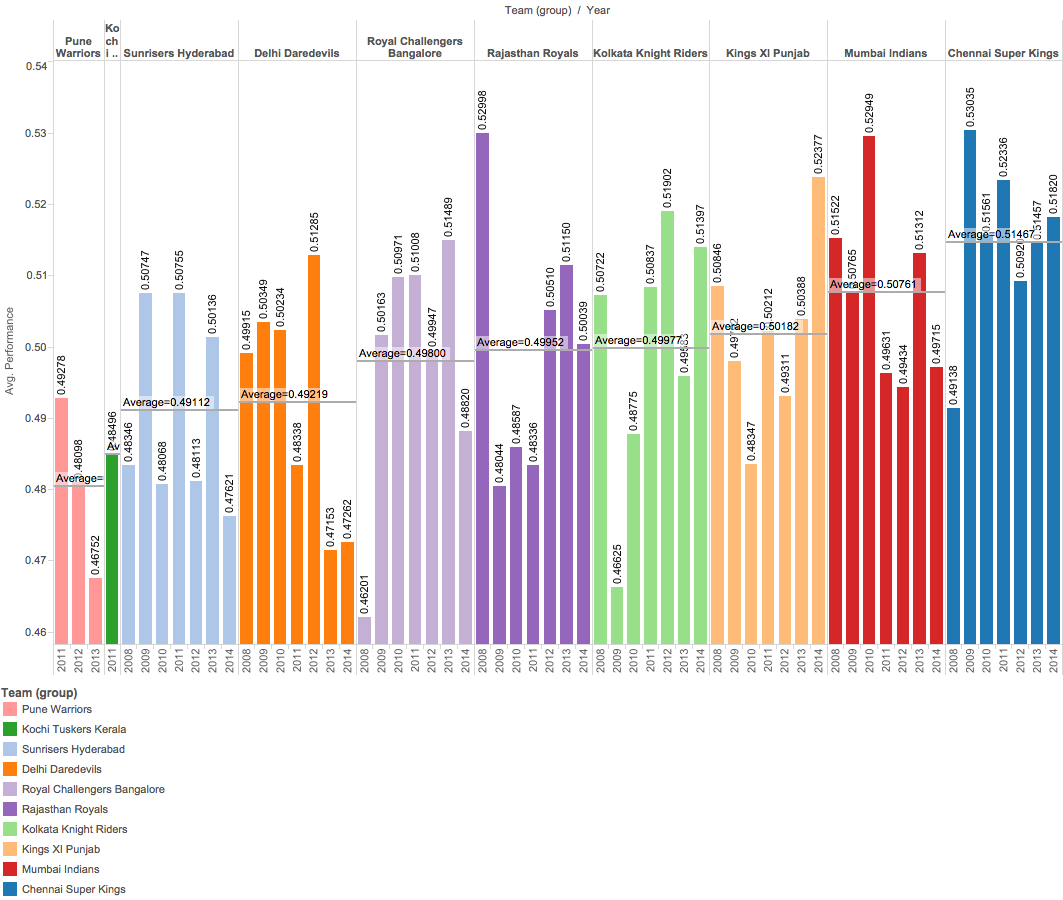
Chennai is the highest, no surprises there. Mumbai comes in second. KKR, despite their two wins, are 5th, explained
by their dismal performance in 2009. Kings XI haven't won a single IPL but come in third.
* Note that Sunrisers Hyderabad and Deccan Chargers have been merged together.
Biggest Win
Which match had the greatest win in IPL history in terms of relative effective score? Funnily it seems the first
Every match of the IPL was the biggest victory. Remember Brendan
McCullum murdering the RCB attack
Kolkata Knight Riders 222/3 (20/20 ov); Royal Challengers Bangalore 82 (15.1/20 ov)
Performance Metric - KKR = 0.7302, RCB = 0.2697
Then comes the
the second match of IPL 2009:
Royal Challengers Bangalore 133/8 (20/20 ov); Rajasthan Royals 58 (15.1/20 ov)
Performance Metric - RCB = 0.6963, RR = 0.3037
In third is the 1st
Semi-final of IPL 2008:
Rajasthan Royals 192/9 (20/20 ov); Delhi Daredevils 87 (16.1/20 ov)
Performance Metric - RR = 0.6882, DD = 0.3118
Head-to-head performance
How do teams usually perform when pitted against each other.
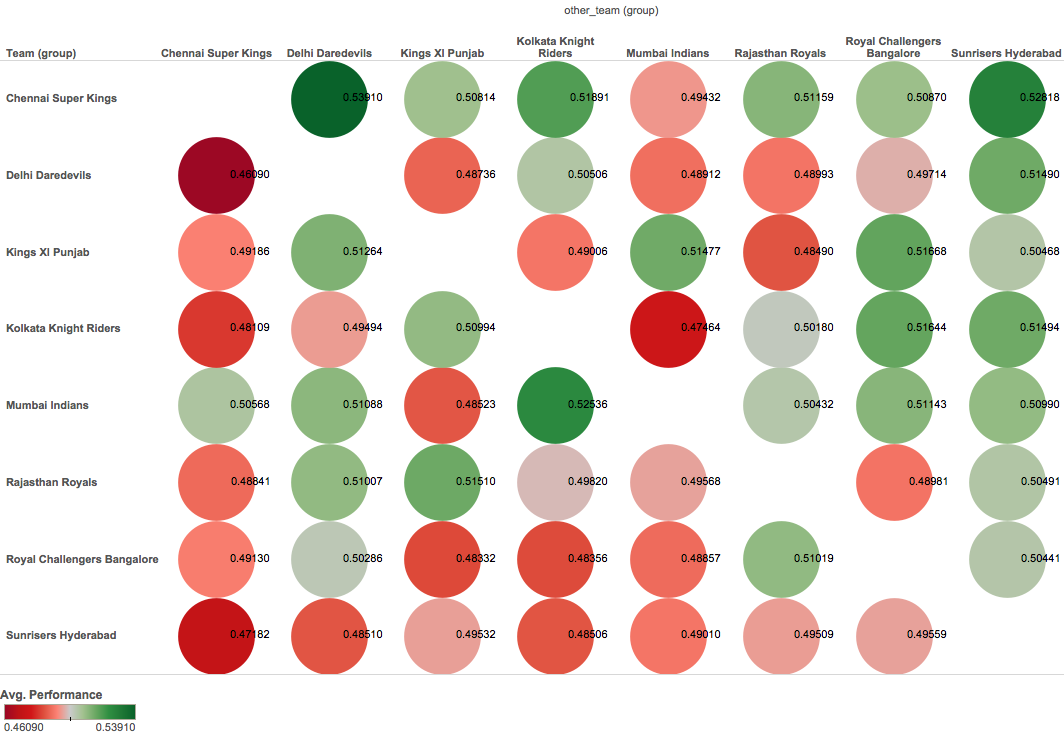
It seems Chennai vs Delhi is the strongest performance in favour of Chennai. Next comes Chennai vs Hyderabad, also
in favour of Chennai. Third is Mumbai vs Kolkata in favour of Mumbai.
Hope you had as much fun reading this blog as we had writing it. Check out some of our other blogs at http://www.incentius.com/blog
Drop us a mail at info@incentius.com to get in touch. Also,, subscribe to this blog on the right to get future blog posts like this one.