So, you’ve recently implemented a change in your sales compensation plan, hoping it will promote your tactical business objectives. How do you test if these changes were effective or not? Were the right behaviors motivated? Are there any unintended consequences? Analytics can be of immense benefit to sales compensation planners in answering these questions. In most cases, data analytics reveals insights that the gut feel of frontline managers just can't capture.
Let's take an example of an FMCG company that underwent changes in their sales compensation plan and discuss some simple analyses that can be performed to visualize the impact of these changes on overall sales and corresponding earnings of the salesforce.
The company in our example has a salesforce that sells four types of products – Detergent, Soap, Toothpaste, and Shampoo. The management wanted to tweak the sales compensation plan primarily to fulfill two objectives: 1. Increase sales of Shampoo due to its higher profitability 2. Improve retention, which had taken a hit in recent months due to more competitive compensation at rival companies
Management decided to increase the commission rate on sales of shampoo by 15%, which, they hoped, would not only encourage reps to sell shampoo more but also put more dollars in their hands, thereby indirectly helping in retention. Let's analyze the impact of this change with different trends over a period of 6 months, 4 months before the plan change took place, and 2 months post-plan change.
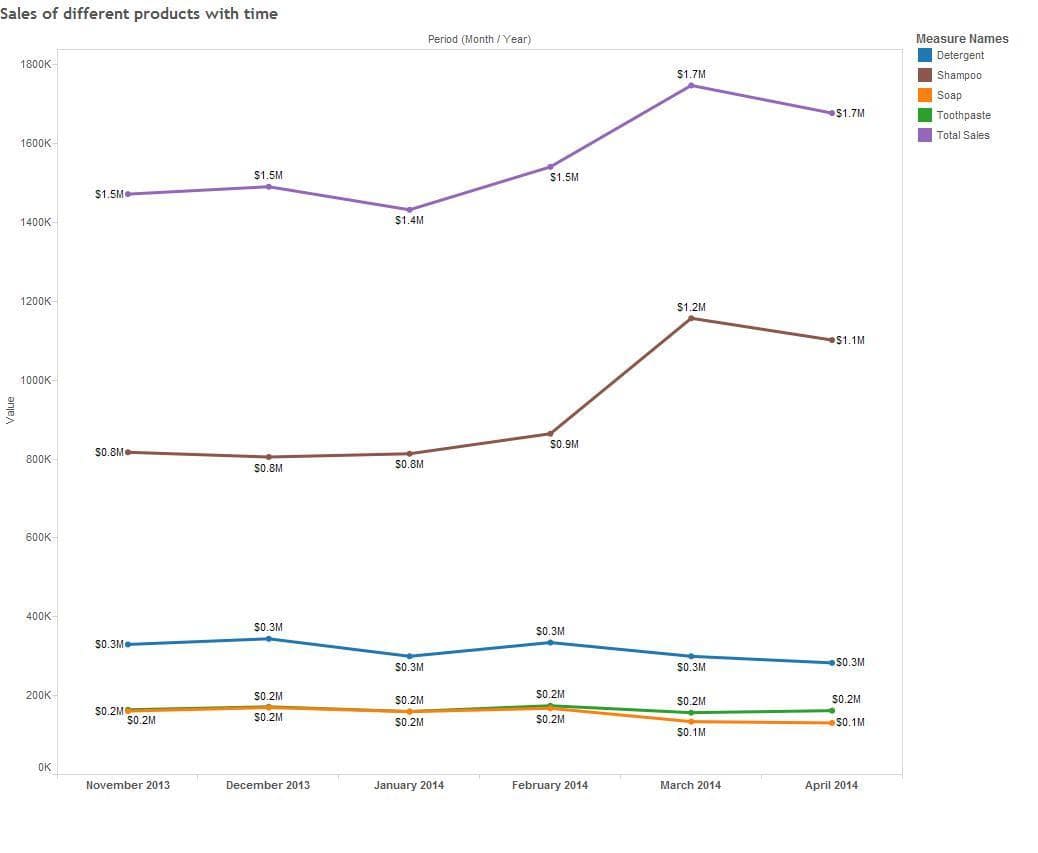
Sales over time

Sales trend over time
This is the simplest chart that shows sales of all products along with total sales (fig 1). The chart shows how net sales have increased in Mar-Apr 2014, mostly due to the increase in sales of shampoo. Hence prima facie it seems the compensation plan change met its first objective.
However, sales of the other products seem to have slightly declined in absolute numbers over the post-plan time period. This is a matter of concern and a probable unintended consequence. This trend needs to be watched over time to ensure that it does not play out as a significant loss in sales over time and may impact the market position of the company. In such a scenario, a further tweak to the compensation plan may be required.
Distribution and Scatter plot of Earnings

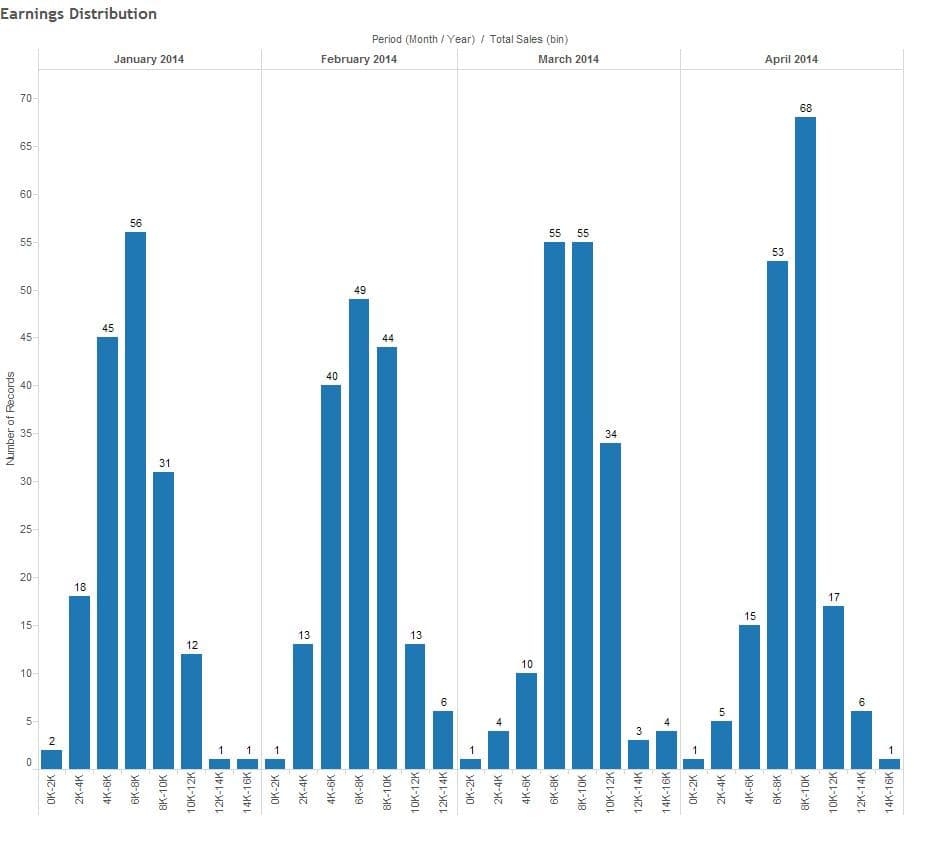
Earnings Distribution over time
The second objective of the plan change was to increase the earnings of reps to promote retention. We use two analyses – distribution of earnings and scatter plot of earnings to visualize how sales rep earnings. The distribution of earnings, as shown in figure 2, indicates that the number of people earning in excess of 10k (target compensation) increased in Mar-Apr 2014. Note how the maximum frequency shifted from $8k in Jan-Feb to $10k in Mar-Apr. Such analyses help management know in a single glance how many people fall in each earnings bracket.

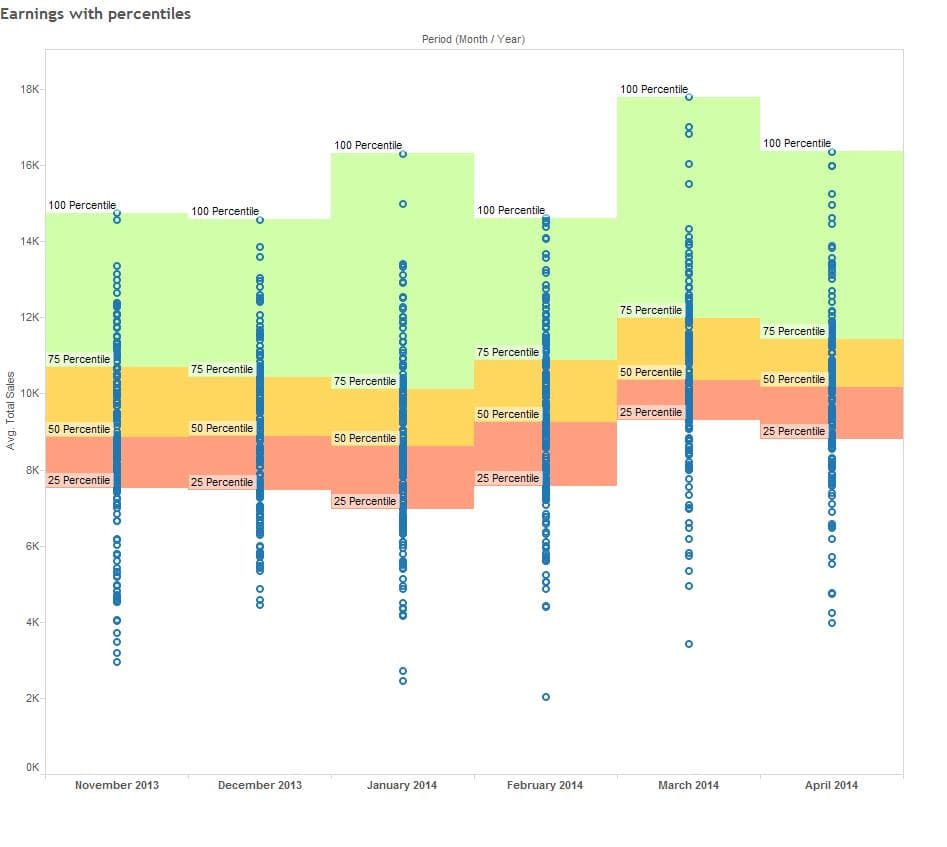
Scatter plot of individual earnings over time
A more powerful analysis that can help gauge rep earnings trends is shown in figure 3. This plot clearly shows the rep earnings along with reference markers for the 25th, 50th, and 75th percentiles of performance. Note that in March-April, not only did the earnings of the 50th and 75th percentile rep have gone up, but the 25th percentile has also shown a significant jump. This shows that the increase in earnings is permeated across the spectrum of earnings levels, which is highly desirable in this case.
Salesforce Strength Analysis

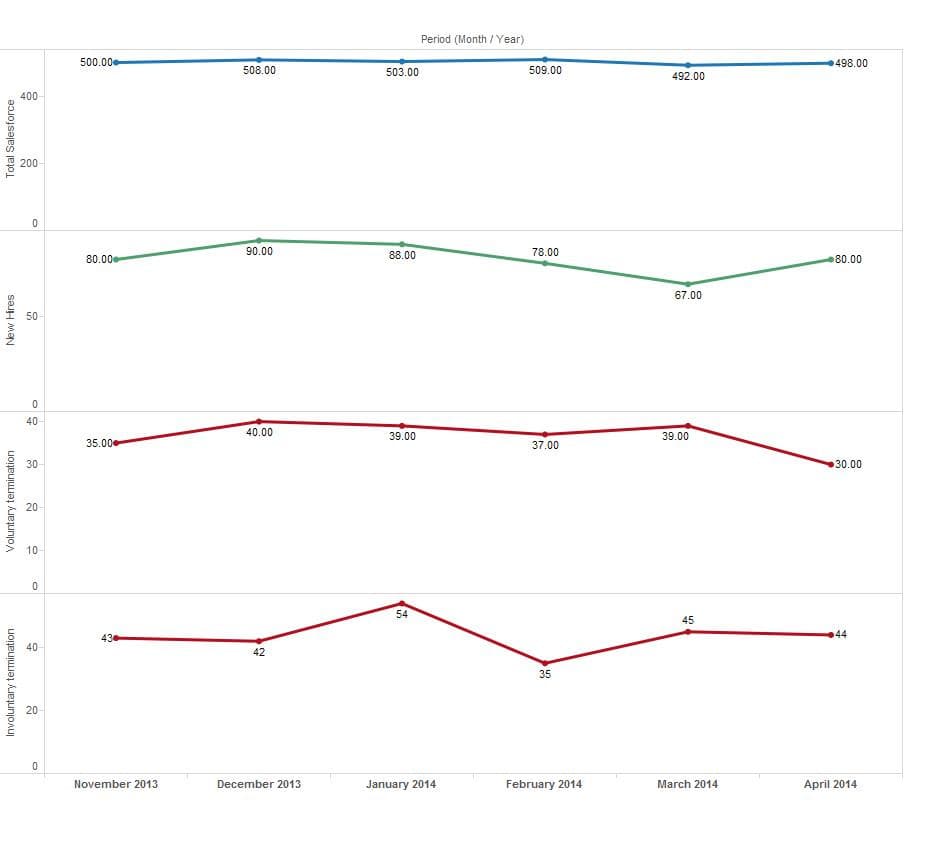
Trend of salesforce strength
A simple analysis that shows the number of employees terminated every month, new employees hired, and total employee strength can be used to gauge the effectiveness of plan change on attrition. Figure 4 shows this analysis. We do not see any immediate significant reduction in attrition in Mar-Apr, but this does not necessarily mean that plan was ineffective on this front. Normally, such parameters take a few payout periods before they show any notable change, and if we continue monitoring this parameter over the coming months, we should expect to see improvements.
This post discussed a case to illustrate some analyses that must be performed post-plan changes to gauge their impact. However, such analyses and others, such as productivity per rep, experience distribution of salesforce, the productivity of newly hired reps, etc., should be tracked periodically as they help reveal invaluable insights and act as an early warning system for potential business threats.
Would you like to get a sample compensation plan analysis for your company? Please email us at info@incentius.com
And if you got this far, we think you’d like our future blog content, too. Please subscribe on the right side.


