The ability to analyze data is a powerful skill that helps you make better decisions. When it comes to choosing a tool, there are several options; however, the first one you think of is Microsoft Excel. Why? It is a tool that is deep-rooted in almost every business and our day-to-day life. The extent of our dependence on it is such that “Export to Excel” is the most used option amongst BI communities. In terms of usage, there are over 750M Excel users worldwide, and literally, any function in any organization/industry can benefit through the use of Microsoft Excel. Additionally, the ability to learn and quickly put it into practice gives you another reason to adopt it.
“I never guess, it is a shocking habit—destructive to the logical faculty” - Sherlock Holmes
Today, we live in an information-rich and time-poor world. Businesses have transformed from being intuitive to data-driven engines. Leaders crave data because they are aware of its availability. However, what they are looking for is not data; it is information and knowledge extracted from it. The big problem, though, isn’t data or too much of it. It’s the lack of time; there just isn’t enough of it to analyze the tons of data you have at your disposal. So, if your organization isn’t using BI tools like Tableau or PowerBI and plan to use Microsoft Excel as a tool for data analyses, this might be of your interest.

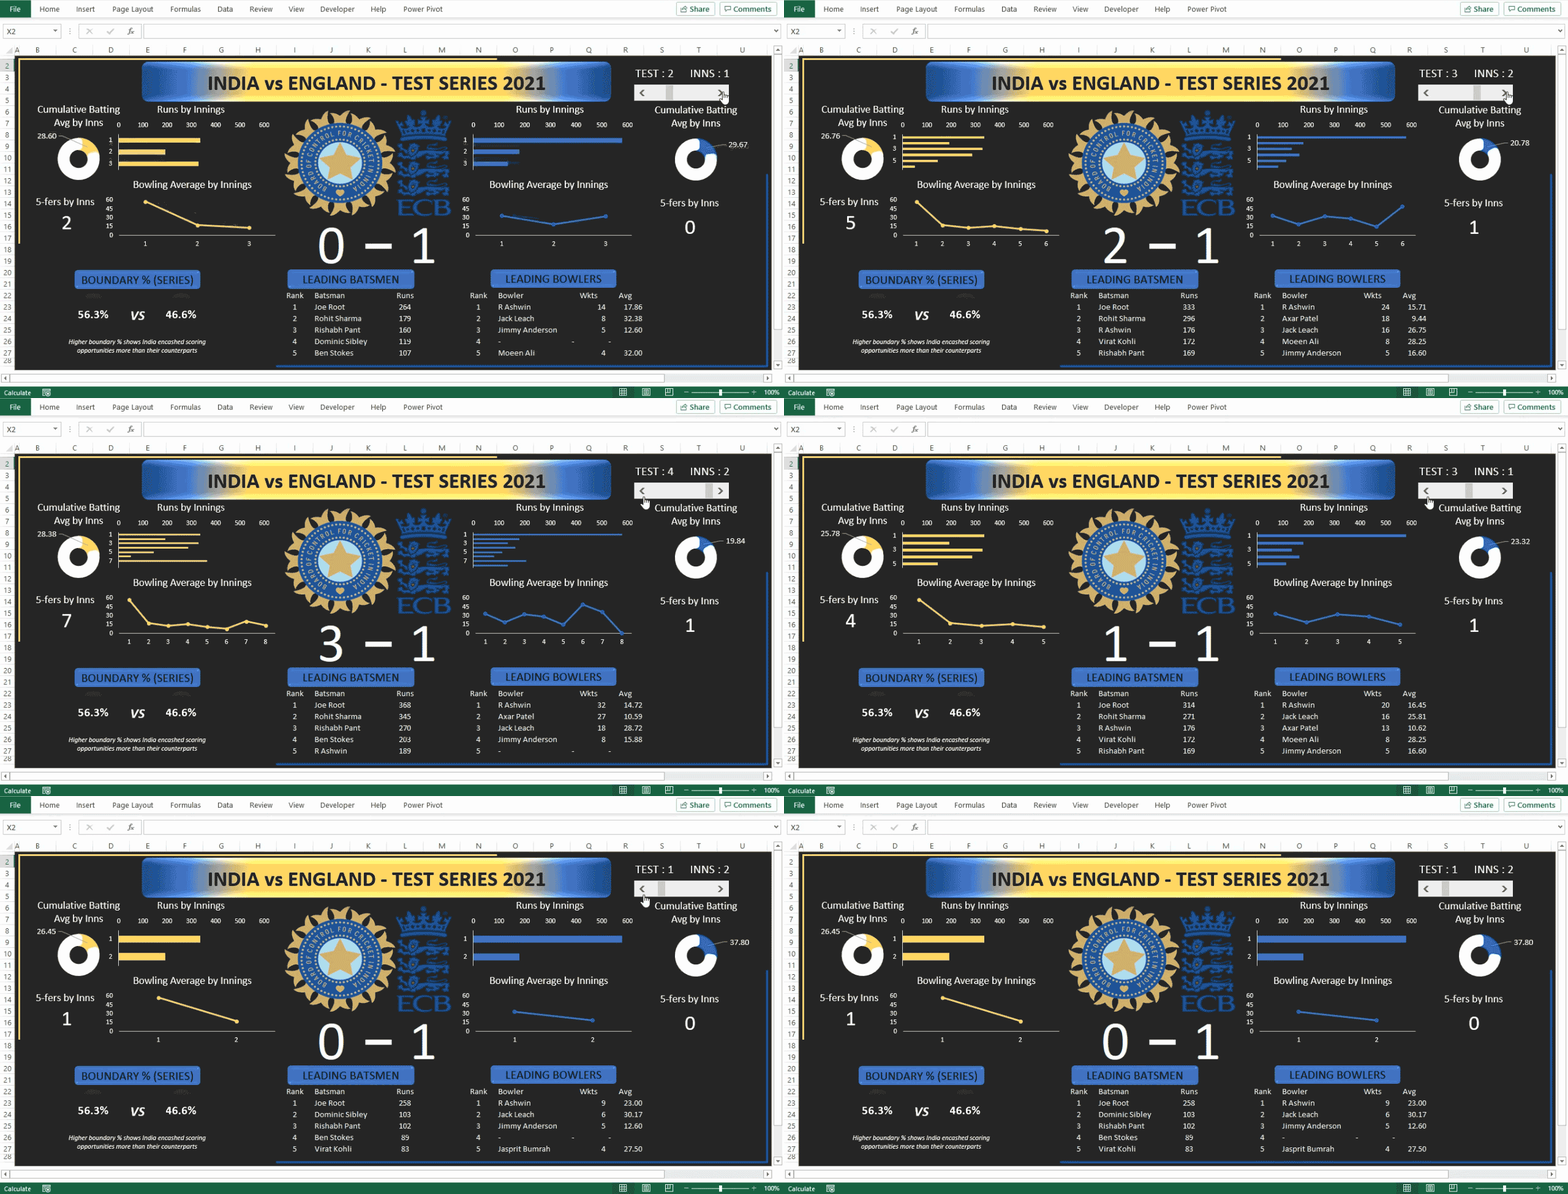
Above is a quick piece of analysis done on the recently concluded India vs England Cricket Test Series. A simple export of scorecards for all the test matches and the use of basic excel functions like IF, SUM, RANK, VLOOKUP, and OFFSET have been used to transform the data into a structured format. There are no VBA macros used anywhere in the analysis, and the visualizations have been created by basic chart options available as a part of the default excel package.
If you are an organization looking to analyze your data and are struggling with it, feel free to reach out to us at Incentius.


