Sales Compensation Analytics: Gauge effectiveness of your IC plan changes Amit Jain June 13, 2014


So, you’ve recently implemented a change in your sales compensation plan, hoping it will promote your tactical business objectives. How do you test if these changes were effective or not? Were the right behaviors motivated? Are there any unintended consequences? Analytics can be of immense benefit to sales compensation planners in answering these questions. In most cases, data analytics reveals insights that the gut feel of frontline managers just can’t capture.

Let’s take an example of an FMCG company that underwent changes in their sales compensation plan and discuss some simple analyses that can be performed to visualize the impact of these changes on overall sales and corresponding earnings of the salesforce.

The company in our example has a salesforce that sells four types of products – Detergent, Soap, Toothpaste, and Shampoo. The management wanted to tweak the sales compensation plan primarily to fulfill two objectives: 1. Increase sales of Shampoo due to its higher profitability 2. Improve retention, which had taken a hit in recent months due to more competitive compensation at rival companies

Management decided to increase the commission rate on sales of shampoo by 15%, which, they hoped, would not only encourage reps to sell shampoo more but also put more dollars in their hands, thereby indirectly helping in retention. Let’s analyze the impact of this change with different trends over a period of 6 months, 4 months before the plan change took place, and 2 months post-plan change.

Sales over time


Sales trend over time

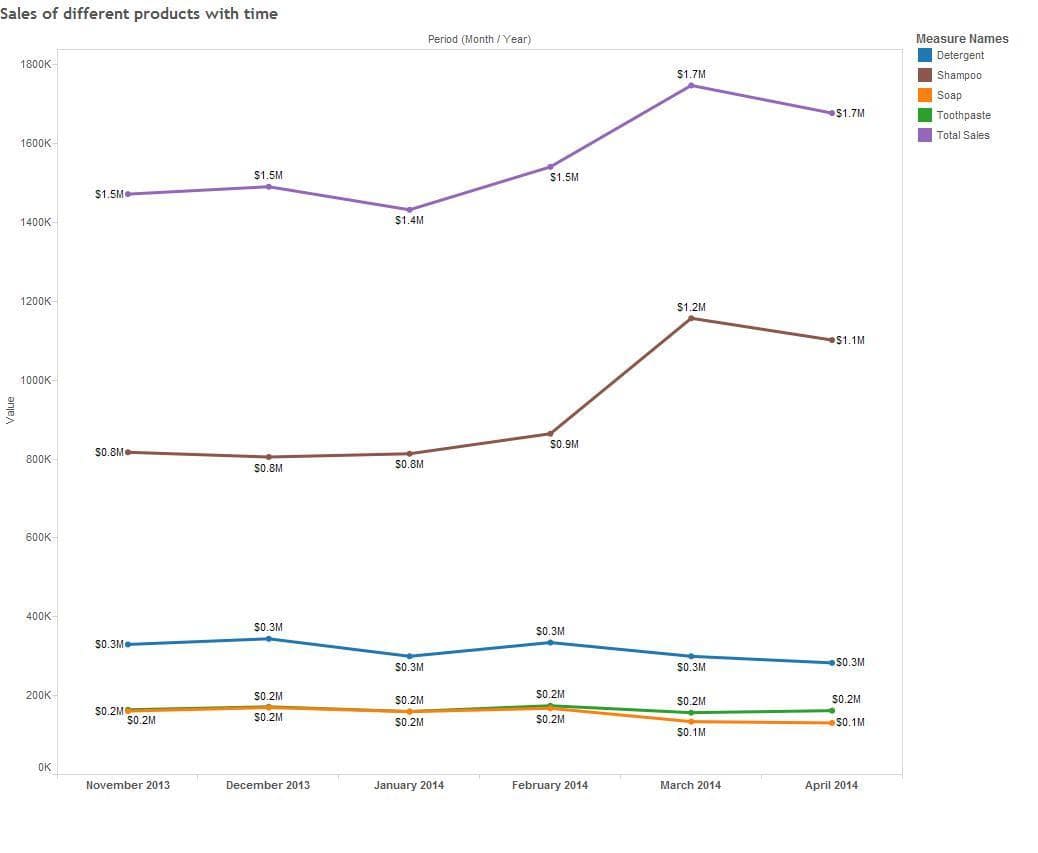
This is the simplest chart that shows sales of all products along with total sales (fig 1). The chart shows how net sales have increased in Mar-Apr 2014, mostly due to the increase in sales of shampoo. Hence prima facie it seems the compensation plan change met its first objective.

However, sales of the other products seem to have slightly declined in absolute numbers over the post-plan time period. This is a matter of concern and a probable unintended consequence. This trend needs to be watched over time to ensure that it does not play out as a significant loss in sales over time and may impact the market position of the company. In such a scenario, a further tweak to the compensation plan may be required.

Distribution and Scatter plot of Earnings


Earnings Distribution over time

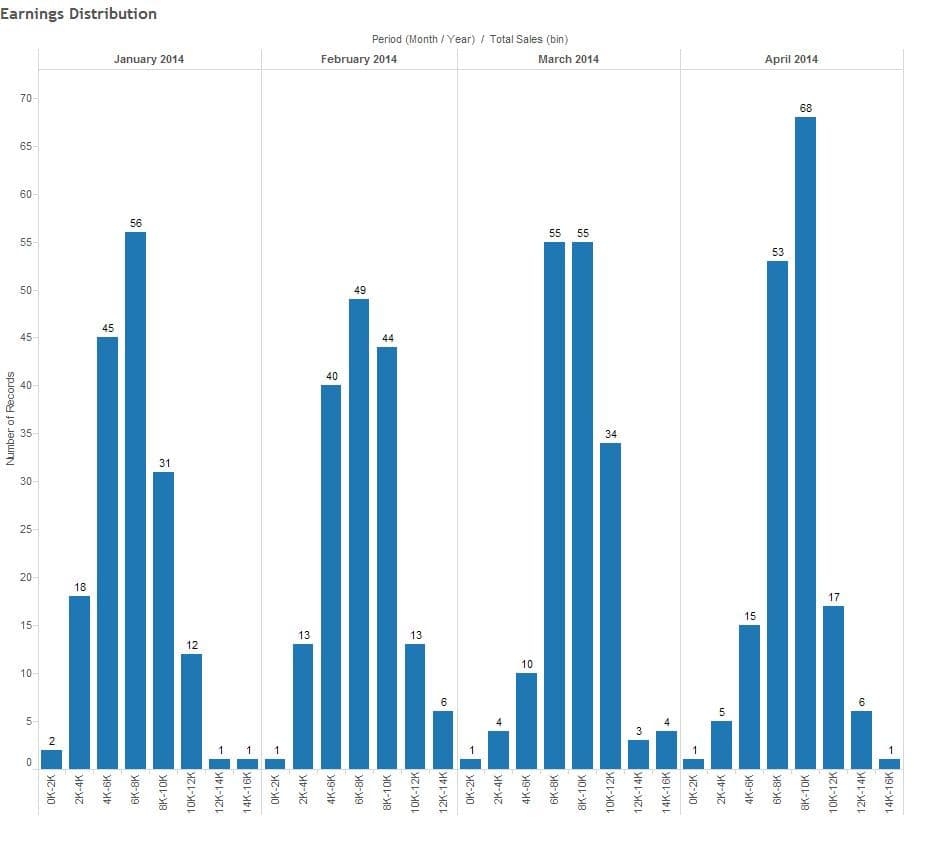
The second objective of the plan change was to increase the earnings of reps to promote retention. We use two analyses – distribution of earnings and scatter plot of earnings to visualize how sales rep earnings. The distribution of earnings, as shown in figure 2, indicates that the number of people earning in excess of 10k (target compensation) increased in Mar-Apr 2014. Note how the maximum frequency shifted from $8k in Jan-Feb to $10k in Mar-Apr. Such analyses help management know in a single glance how many people fall in each earnings bracket.


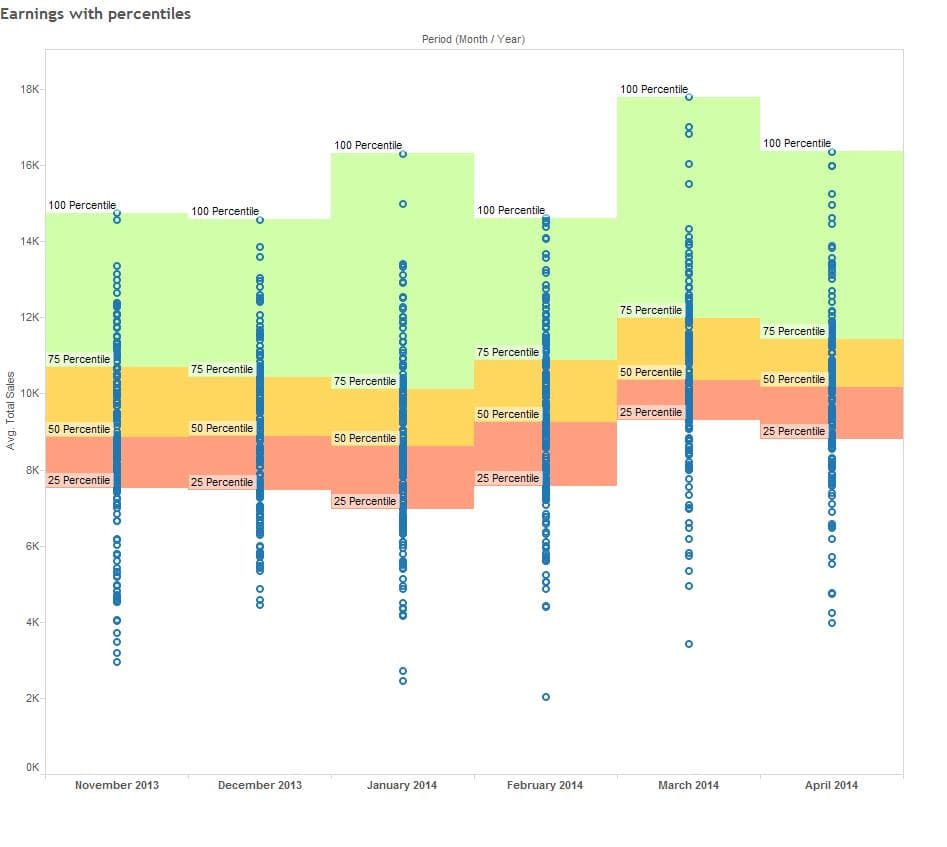
Scatter plot of individual earnings over time

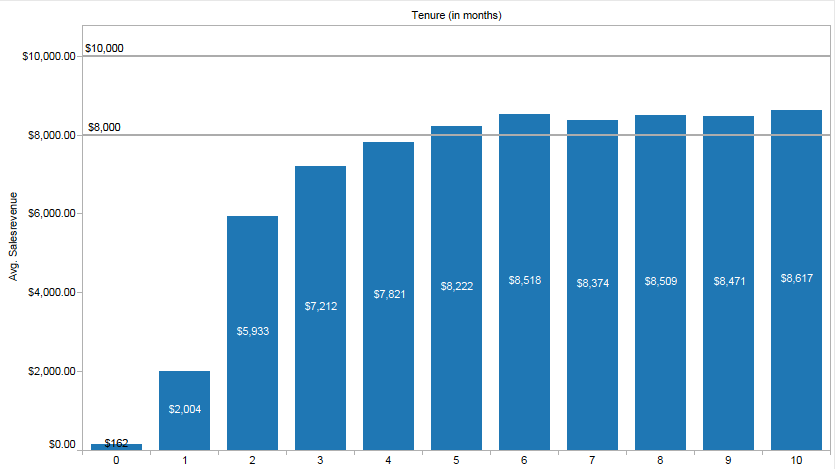
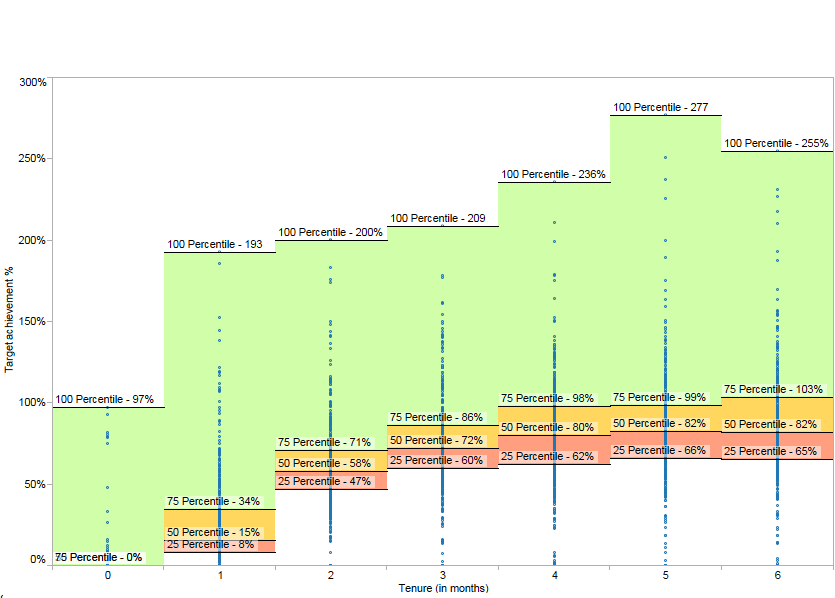
A more powerful analysis that can help gauge rep earnings trends is shown in figure 3. This plot clearly shows the rep earnings along with reference markers for the 25th, 50th, and 75th percentiles of performance. Note that in March-April, not only did the earnings of the 50th and 75th percentile rep have gone up, but the 25th percentile has also shown a significant jump. This shows that the increase in earnings is permeated across the spectrum of earnings levels, which is highly desirable in this case.

Salesforce Strength Analysis


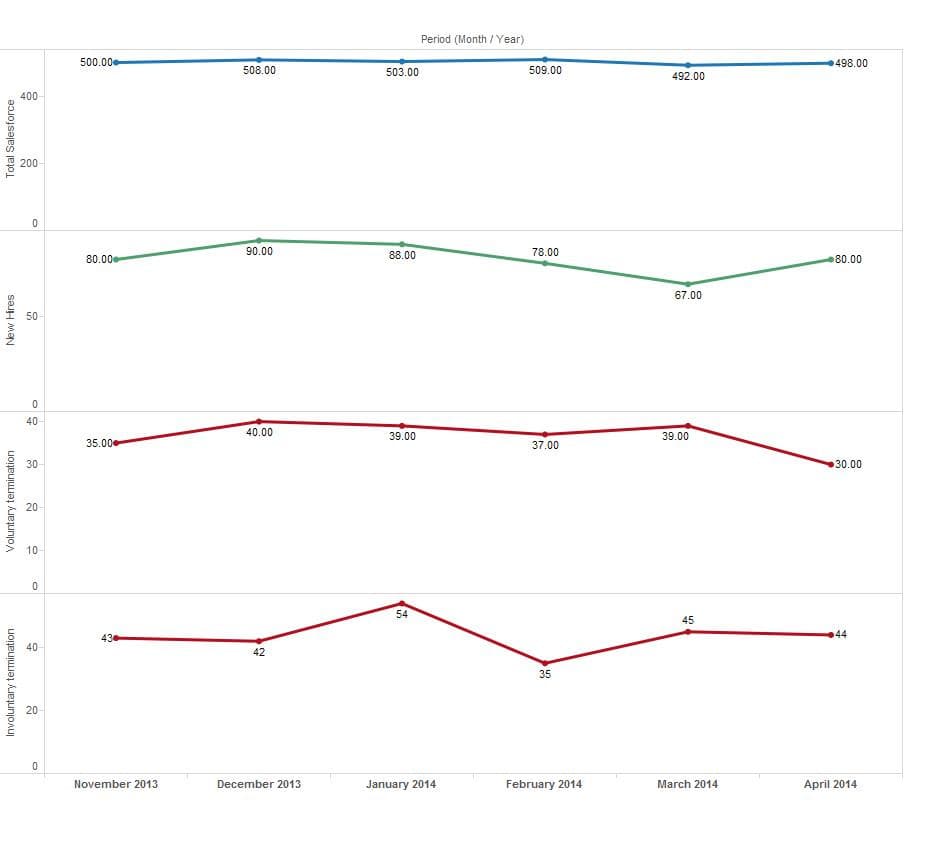
Trend of salesforce strength

A simple analysis that shows the number of employees terminated every month, new employees hired, and total employee strength can be used to gauge the effectiveness of plan change on attrition. Figure 4 shows this analysis. We do not see any immediate significant reduction in attrition in Mar-Apr, but this does not necessarily mean that plan was ineffective on this front. Normally, such parameters take a few payout periods before they show any notable change, and if we continue monitoring this parameter over the coming months, we should expect to see improvements.

This post discussed a case to illustrate some analyses that must be performed post-plan changes to gauge their impact. However, such analyses and others, such as productivity per rep, experience distribution of salesforce, the productivity of newly hired reps, etc., should be tracked periodically as they help reveal invaluable insights and act as an early warning system for potential business threats.

Would you like to get a sample compensation plan analysis for your company? Please email us at info@incentius.com

And if you got this far, we think you’d like our future blog content, too. Please subscribe on the right side.


Sales Commissions – Tiered, Incremental, Retroactive – What do they mean? Amit Jain May 21, 2014


Commissions on sales are the simplest and perhaps the oldest form of incentives. Sales commission plans are generally easier to communicate to salespeople and, at times, have a greater impact on salesperson behavior due to their simplicity. They are more prevalent in cases where sales goals are difficult to define, either due to uncertainty in the market or due to the business being new or in an indirect/agent-based sales channel. These types of plans are also common in situations where an organization wants to reward total unit or dollar volume and believes that all individual reps have equal earning potential.

Straight sales commission plans are easy to administer, but at times sales commission plans need to be tweaked to help ensure that salesperson behavior is aligned with organizational goals. It becomes more critical in instances when a salesperson has much more control over price negotiations or the organization would like to focus on sales growth. This post will discuss the different variations of commission-based plans that companies employ to ensure that salesperson behavior conforms to their business objectives.

The simple sales commission plan

This is the simplest type of plan in which a flat commission dollar value is paid per unit sale. However, the unit of measurement for which the commission is paid may depend on the company’s objectives. More often than not, the flat commission may be paid per dollar of revenue sold by the salesperson or per widget sold.

The tiered sales commission plan

In such a plan, the commission paid increases progressively with the sales unit of measurement. Figure 1 shows an example of a tiered sales commission plan. The increase in commission may be of two types depending on whether the increased commission applies to all revenue or only the marginal revenue which falls in that higher tier :

  1. Retroactive Commission: Here, the increased commission rate achieved by breaching higher tiers is applied to all revenue, leading to a sharp increase in total commission as a rep crosses a certain threshold. For example, in figure 1, if the rep makes $9999, he would be paid a commission of 10% X $9999. However, if his revenue increases to $10000 and the plan is retroactive, his commission would sharply increase to 15% X $10000 which is effectively a 50% jump in commissions.
  2. Incremental Commission: In such a sales commission plan, the increased commission is applied to only the incremental revenue which lies in the higher tier. So, in the example above, the revenue of $10000 would yield $999910% + $115% as commission which is effectively an incremental increase in total commission.

figure 1 Figure 1

The commission table above has sales revenue as a basis. However, other metrics (such as the net profitability of products sold) may determine the tier in which the replies are. Here is a list of commonly used metrics by companies to determine the commission tier:

  1. Profitability: Selling more profitable products means a higher commission rate.
  2. Contract Length: This is normally used in industries where recurring payments are made by the client. For example, companies that sell SAAS contracts receive periodic payments from clients and hence would like to incentivize their sales team to sell software for a longer contract term. Tiers are determined on the basis of contract length, and the higher the term, the higher would be the commission rate.
  3. Sales Revenue
  4. Sales Volume/Number of Widgets
  5. Custom defined: Sometimes, companies define custom parameters to determine the commission rate. This is generally used to direct sales behavior when the reps sell a large portfolio of products. An example is given below – A company has 4 products (see table 1) that differ in pricing. Now, the company wants to implement a commission-based plan in which the commission rate would be applied to net revenue. The company also wants to promote two products – gas-based and diesel gen-sets because of their higher profitability. To implement this, the company can assign a custom parameter called ‘points’ to each of its products which would determine the commission rate tiers (see table 2). Hence reps are incentivized to sell diesel and gas-based gensets in greater volumes to help them to achieve higher commission rates. Effectively their behavior is tuned towards not only selling more but also selling the products that the company wants them to push more.

Table 1 Product Price Points Electric Motors $ 1,250 1 Diesel Gensets $ 3,000 2 Transformers $ 4,200 1 Gas-based gen-sets $ 2,800 2 Table 2 Units Commission 5 – 10 10% 10 – 15 12% 15 – 20 14% 20 – 30 16% 30 + 18% Commission over quota plan

Sometimes commission-based plans and quota achievement plans are mixed to build a hybrid plan. In this, a target is set, and reps are paid on the basis of their % target achievement until they reach 100%. Post 100%, in addition to their target incentive, they are paid a fixed percentage as a commission on the extra sales they make above their target quota. These types of plans are commonly used in the pharmaceutical sector.

Performance metrics for sales commission plans should always be chosen based on desired business objectives, and appropriate safeguards should be introduced to accomplish the end result without being financially irresponsible.

Would you like to get a sample sales commission plan analysis for your company? Please email us at info@incentius.com

And if you got this far, we think you’d like our future blog content, too. Please subscribe on the right side of Incentius.


Sales compensation plans for improving new hire productivity Amit Jain May 13, 2014


Attrition is generally high in sales functions which makes it extremely important to have a good ramp-up strategy in place to attract top talent. To ensure motivation when newly-hired reps are still adjusting to their role, they are generally provided extra incentives or are put on special compensation plans with lower sales targets. The type of acceleration provided during the initial months depends heavily on the type of role and the industry. Some popular incentive plan designs that are used for new-hire reps are:

  • Reduced Quota/Goal: Many companies provide reduced goals during the initial months. The goals increase every month till they reach the desired potential goal at the end of the ‘Ramp period’. For example, the rep may be assigned 20%, 40%, 60%, and 80% of the full rep goals in the first, second, third, and fourth months of employment and full rep goal thereafter.
  • Fixed incentive: Salespeople are sometimes paid a fixed incentive (mostly equal to target compensation) during their ramp period in industries where it is difficult to make a single sale during the initial months. These are primarily the case where the sale is a large complex sale, and tenured sales reps only make 1-2 sales per month. The clear downside to this plan is that reps have no motivation to make sales during their ramp period and may sometimes defer sales to get incentives on them after they graduate from the regular compensation plan.
  • Combination of fixed-guarantee and variable incentives: In this type of plan, newly hired reps are awarded a part of their target incentive as a fixed guaranteed amount and are free to earn the remaining incentive on the sales they make. For example, if an average new-hire rep makes 70% of the target incentive, he can be paid a fixed 30% incentive and be allowed to earn the rest on the basis of his sales. In such a plan, the rep has the motivation to sell more, even during the initial months, to overachieve on his incentive payment.
  • Management by objective (MBO): Some organizations treat new hires by assigning them a purely subjective MBO compensation plan during their ramp period. The reps may be required to complete fixed objectives such as completing specific training or achieving some certifications. On the basis of their performance in these objectives, they are awarded incentives.

The primary struggle in defining such new hire ramp plans lies in gauging correct parameter values such as duration of the ramp, quota relief given each month, guaranteed amounts paid each month, etc. These are often set based on the ‘gut feel’ of compensation managers and might not necessarily correspond to ground realities. Simple analytics can be used to design the optimum plan for new-hire sales reps, which helps them achieve their target incentive while motivating them to sell as much as possible, thereby increasing their sales productivity.

For such analysis, let’s assume we’ve decided to utilize the reduced quota/goals strategy for the new hire ramp period. In order to design this plan, we need to answer 2 questions:

  • How long should the ramp duration be?
  • How should the quota be progressively increased as the rep matures?

To answer these questions, we categorize reps on the basis of their tenure and plot their average revenue achievement against the full rep quota (See figure 1). This shows the profile of rep performance improvement as they mature. It is clear from the graph that sales achievement in initial ramp months is very low and increases progressively until it reaches 80% in the 4th month after hire. Thereafter, the rate of increase slows as rep matures further, and achievement eventually plateaus off. This makes a good case for a ramp duration of 4 months.


Figure 1 :Reps are categorized on the basis of their tenure and average revenue achievement of reps in a specific tenure category is plotted. For example, the graph shows that employees who have been in the company for 1 month achieve, on an average, 20% of the revenue quota.

In addition, we also plot the distribution of sales achievement of all reps within a specific month since hire and identify the quartile markers (see figure 2). This helps us determine if particular reps are overachieving compared to others. The graph shows that the median (50th percentile) is steadily increasing over the initial months, and the values are similar to the averages we plotted in figure 1. 80% target achievement for a rep with 4 months of tenure passes the ‘gut-feel’ test as well. The rep can be expected to mature further without earning substantially lower than his target incentive. Had this number been around 60%, we might have further extended the ramp duration as it suggests that reps require more time to adjust to their role.


Figure 2 : Plot of achievement of all reps categorized on the basis of their tenure. The 50th percentile shows an increase with the increase in maturity level of reps.

Having decided on the ramp duration, the next step is setting progressively increasing quotas for each month. For this, we need to see how sales reps’ achievement ramps as their tenure progress (s


Figure 3: Reps are categorized on the basis of their tenure and their sales revenue is plotted. For example, the graph shows that employees who have been in the company for 1 month make sales of $2004 on average

While these numbers are analytically determined on the basis of data, company sales management would probably prefer to tweak these numbers based on their business judgment. Nevertheless, these analyses help create a great first pass and help company sales leaders to make a more informed decision.

If you got this far, we think you’d like our future blog content, too. Please subscribe to Incentius on the right side.