An issue that every company deals with is attrition. Sales being an especially high attrition function makes this analysis paramount. Sales attrition is a result of several components, including unoptimized sales compensation, unrealistic quotas, ineffective mentoring, career-path ambiguity, training inefficacy or just bad recruiting. Hence the ability to slice and dice sales attrition in many ways to understand trends and their root causes can seriously help sales leadership make the required changes to build a healthier, more performing sales force.
Numerically analyzing attrition is a bit tricky. This stems from the fact that the base of employees is continually in flux. Every month new hires join the salesforce, some employees are involuntarily terminated, some voluntarily leave the company, and some others go inactive without leaving the company, like when they go for a long-term leave of absence. Additionally, the quality of attrition is important. Let's say two companies of about the same size lose about 25 salespeople a month. Are they experiencing the same problem? What if one company is losing more experienced salespeople whereas the other was losing mostly salespeople only 2-3 months in the company? Both these companies have wildly different problems. The first one may have an issue like their sales compensation program not rewarding top performers enough, but the other one may have a recruiting issue since new hires are probably not relating their job to what they were told during recruiting.
There are myriad ways in which we can slice attrition. In this blog, we'll list a few methods:
Attrition rate
The rate of attrition or the inverse retention rate is the most commonly used metric while trying to analyze attrition. The attrition rate is typically calculated as the number of employees lost every year over the employee base. This employee base can be tricky, however. Most firms just use a start-of-year employee count as the base. Some firms calculate it on a rolling 12-month basis to get a full-year impact. This ratio becomes harder to use if your firm is growing its employee base. For example, let's say on Jan 1st of this year, there were 1000 employees in the firm. Over the next 12 months, we lost 100 employees. Is it as straightforward as a 10% attrition rate? Where it gets fuzzy is how many of those 100 employees that were lost were in the seat on Jan 1st. Were all the 100 existing employees as of Jan 1st, or were they new hires during the year that termed? Hence the attrition rate must be looked at from several views.
Existing employee attrition
This type of view asks the question, "How many of my employees who worked here a year ago today have left". This fixes the set of employees you're looking at to just those that were employed 12 months ago. The figure below plots how many of those employees hired 12 months ago are still in their seats over the 12 months. The plot would always be a strictly decreasing curve. Here is a sample graph from a firm.
Such a view is more important to look at because it tends to show you where slightly more tenured employees leave. This leaves out those that joined and quit in 3 months which is more of a localized recruiting issue rather than a systematic issue in the company.
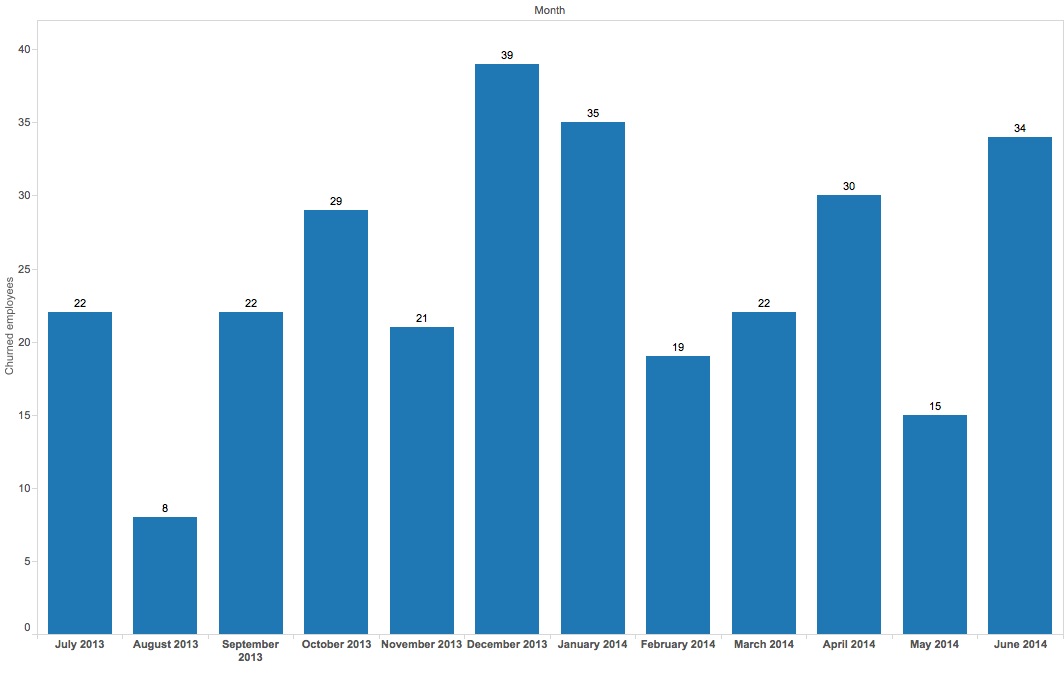
Total employee attrition
This type of view displays total attrition by month. It does not discriminate as to which employees quit, whether they were new hires or they were 3-year tenured employees. The plot below shows how many employees quit each month over the last 12 months.
Employee Tenure
Closely related to employee attrition is total employee tenure. The more employee attrition, the less the average tenure of employees in the company. Let's look at a few ways we can track employee tenure performance over time. First, let's define what a tenured employee means in the context of your company. Some folks call this the break-even period as to the time it takes for an employee to mature. This may vary from 6 months to 1.5 years based on the complexity of the sales process, the tools involved and the product sales lifecycle.
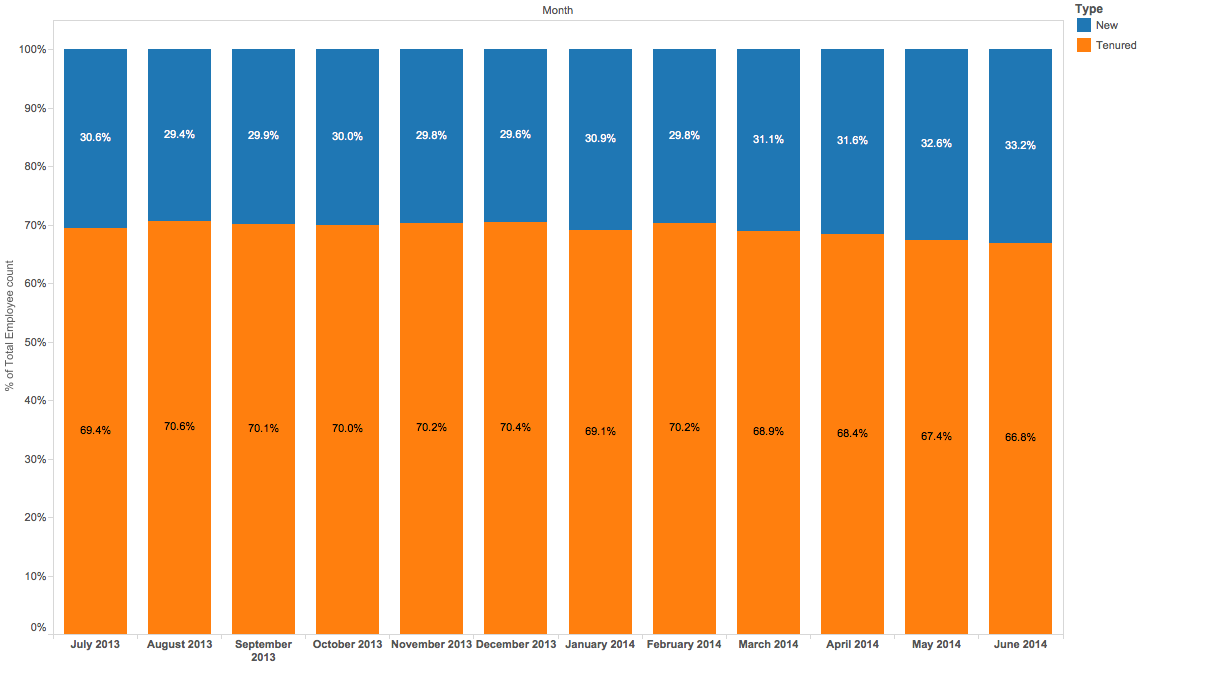
Tenured employee proportion
First, let's look at the proportion of employees who are tenured vs those that are new. Higher the tenured proportion, the better job the company is doing at retention. This also directly impacts sales performance because tenured employees tend to do better than new ones.
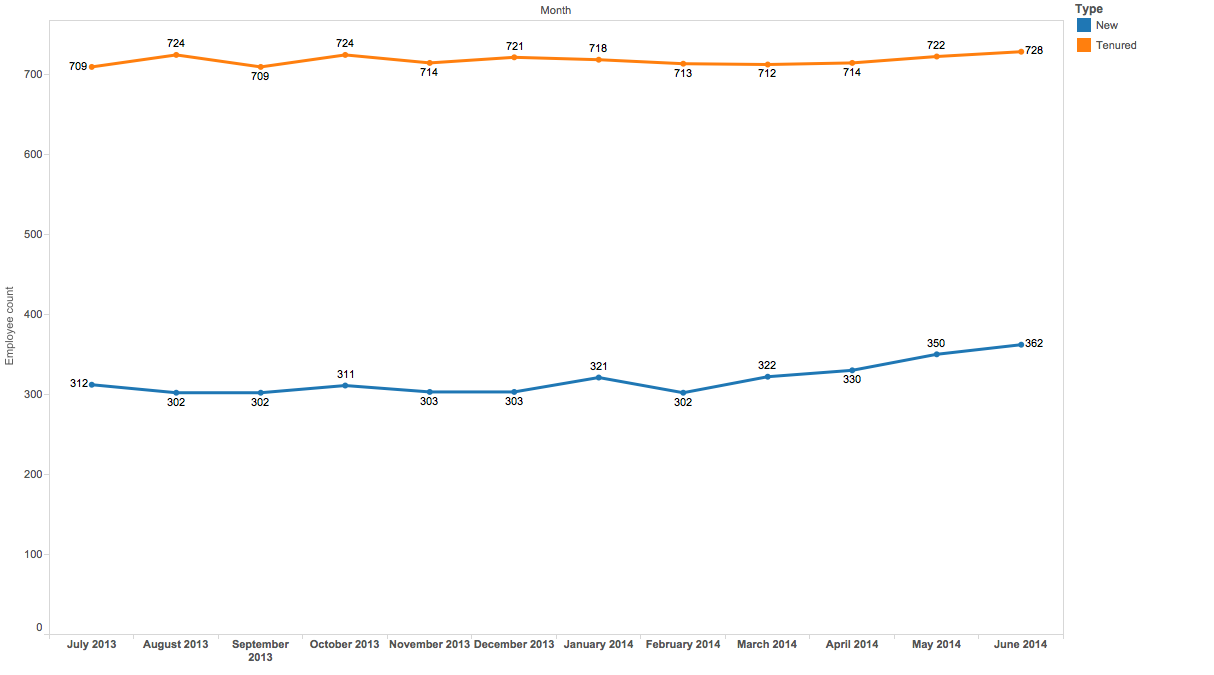
Tenured employee actual
In a growing company, however, just looking at the proportion of tenured employees to new is not enough. As new hires come in to increase the employee base, the Tenured employee proportion would auto-decline. Hence we should also look at the actual number of employees who are tenured. Below is the graph of actual tenured vs new hire employee counts for a firm.

Notice in recent months that both tenured and new hire counts have been increasing. This means that while the company is hiring more to increase the new hire counts, it's doing a better job at retention as well since more tenured employees are staying on.
Batch-wise churn analysis
Is every batch of new hires that join your company the same? Do they perform identically? A view of that can be very useful to study the 'employee lifecycle' to see how they start off and how they perform as they mature. This information can be critical when cross-referenced with the hiring sources and may also be used for recruitment performance.
Below is a view of employees that were hired in a particular month and how that batch churned over their lifetime at the company. This is typically possible to do if we have at least 2-3 years of company performance history.
Conclusion
HR analytics is an up-and-coming area that can make HR departments in companies highly data-driven and improve their efficiency manifold. Incentius can help build such HR analytics for firms to revolutionize their HR operations.
As a bonus, we have a free interactive tool to estimate the financial impact of attrition of a salesperson. Would you like to get a sample employee attrition analysis for your company? Here is a free tool for your use. Feel free to download and try it out, and do write to us at info@incentius.com if you need a detailed analysis of several other metrics.
And if you got this far, we think you’d like our future blog content, too. Please subscribe on the right side.