Tableau visualizations for logistics operations Anurag Chilukuri July 8, 2014
Logistics companies operate on thin margins in a highly competitive, fast-paced business environment. This increases the importance of analyzing ongoing operations, making tactical decisions, and refining governance structure to help improve operational efficiency and remain competitive.
As part of this blog post, we will be sharing analyses ideas for US domestic 3PL companies who deal in air shipments
and ground linehaul with the help of Tableau software (advanced
mapping
functionality and insightful
visual display of data) to better understand their operational constraints and subsequently identify areas for operational efficiency.
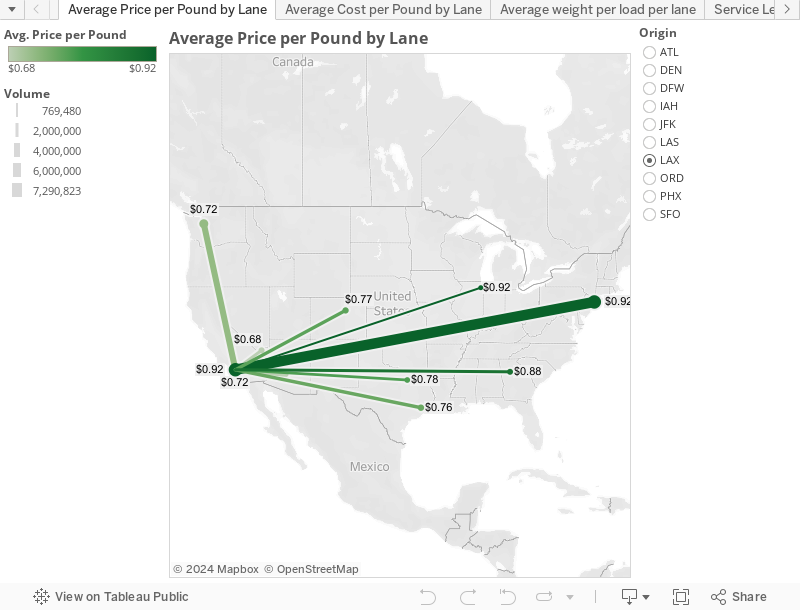
Let us look at hypothetical data for a 3PL company and analyze shipments being moved across major hubs. As part of this exercise, let’s analyze the price per pound, cost per pound, volume, and average weight per load for all the major transportation lanes with LAX as either origin or destination.
FYI, all the charts we’ve displayed in this blog post are dynamic. Please feel free to click around and interact
with the charts.
1. Price per pound for ground shipments
The shipping Rate is highest in LAX-JFK and LAX-ORD lanes.
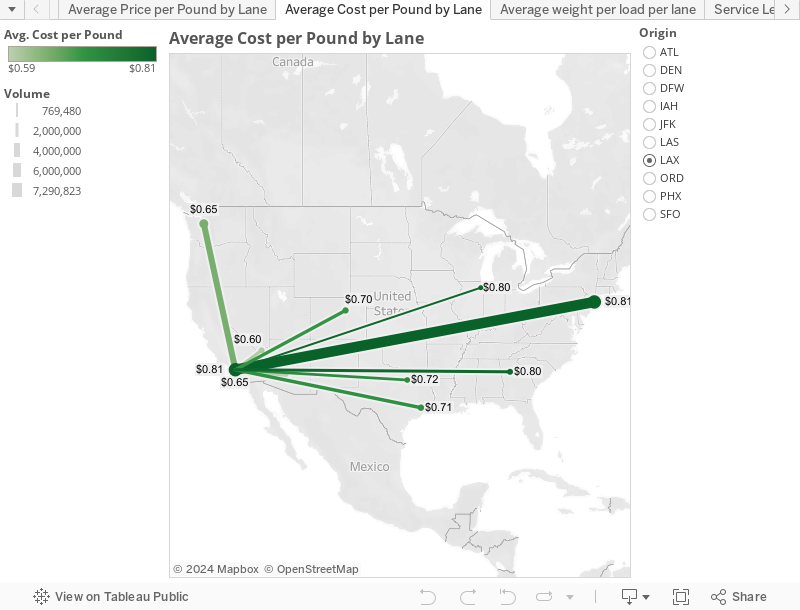
2. Cost per pound for ground shipments
Cost is highest in the LAX-JFK lane
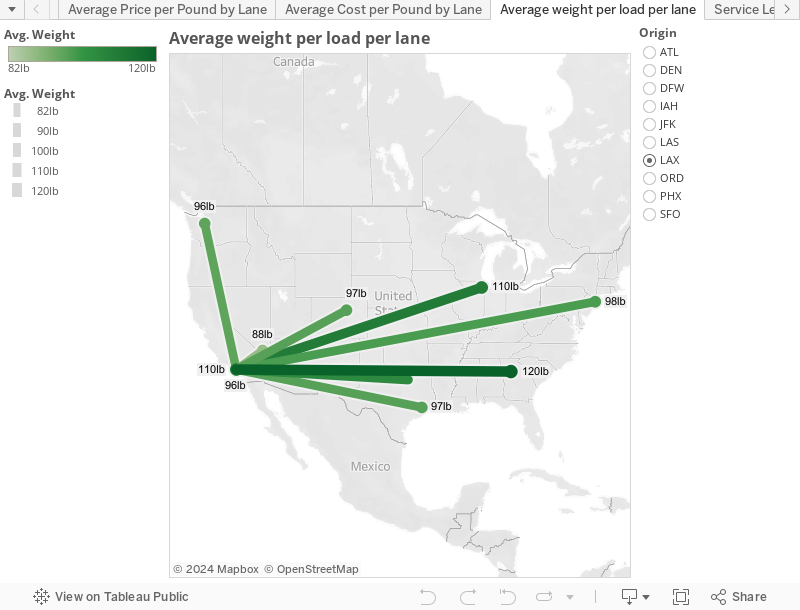
3. Average weight per load
Higher for LAX – ATL lane; Lowest for LAX – SFO lane
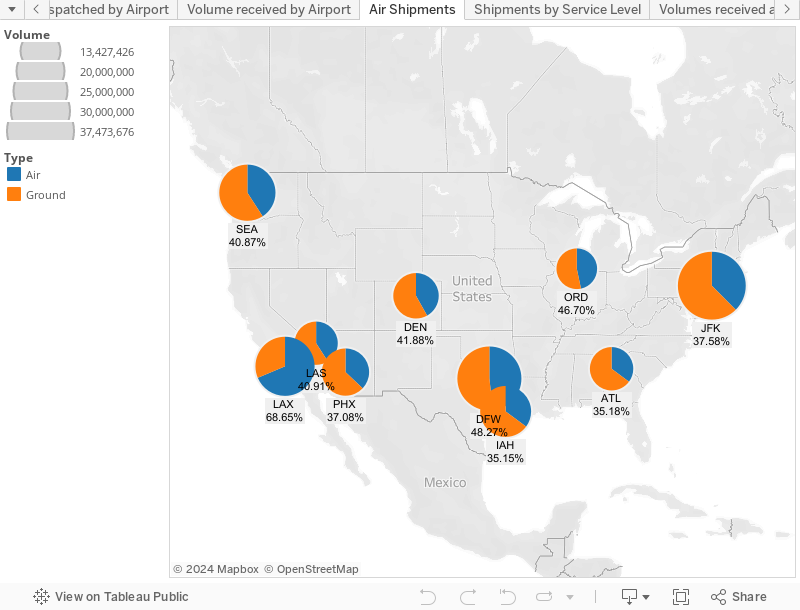
4. Movement of domestic shipments by different modes (Air vs. Ground) –
This graph gives an idea about the split between shipments received by air and ground modes by each hub. Looking at the following graph, we can observe that the balance is tilted in favor of air shipments as compared to ground shipments for the LAX hub.
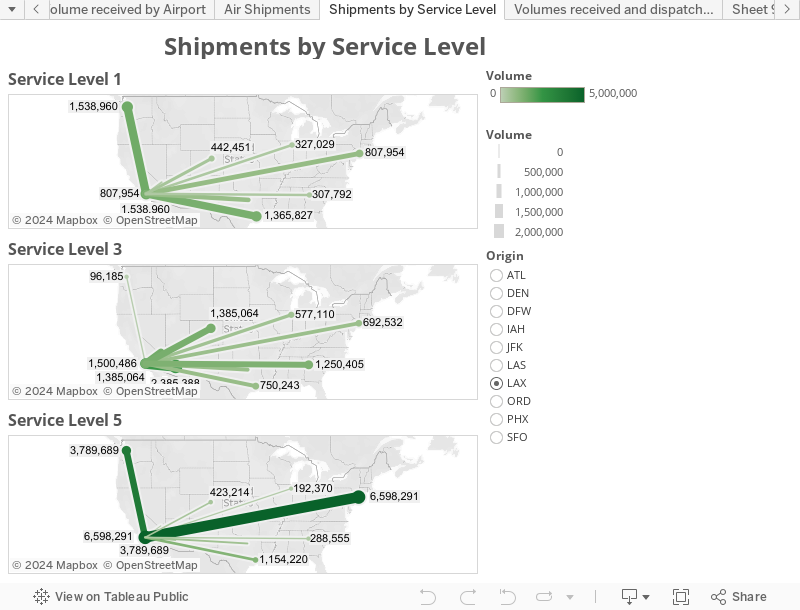
5. Service Level
The following graphs show shipments that move from LAX to a different hub based on their service level. The first graph shows shipments that move via a 1-day service level, the second graph shows shipments that move by a 3-day service level, and the third graph displays shipments that have 5-day delivery. The majority of shipments are either being delivered using a 1-day express delivery mode or through a standard 5-day delivery service.
6. Volume received and shipped by airports
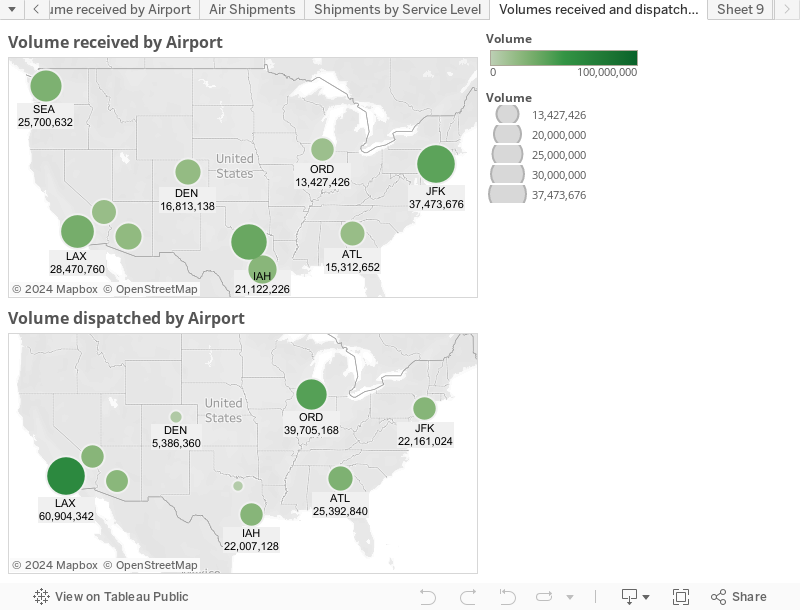
It is clear from the dashboard that LAX is the biggest dispatcher of shipments domestically since most of the US imports arrive in the US at the LAX port facilities, which are then distributed domestically.
Also, the number of incoming shipments into JFK is larger than the outgoing shipments, which holds to reason. Such volume analysis helps companies in planning and allotting receiving and dispatching staff to airports accordingly.
Conclusion
Such analysis can help the operational planning departments of 3PL companies in improving their efficiencies. Please
visit our dashboard and reporting page for more information.
